Stop chat-testing your DGX Spark
A single chat window is the one benchmark the DGX Spark is built to lose. The two hardware numbers behind that, and the 22-43x you get back from batching.
I watched mine crawl along at about 57 tokens a second in a chat window and very nearly sent it back.
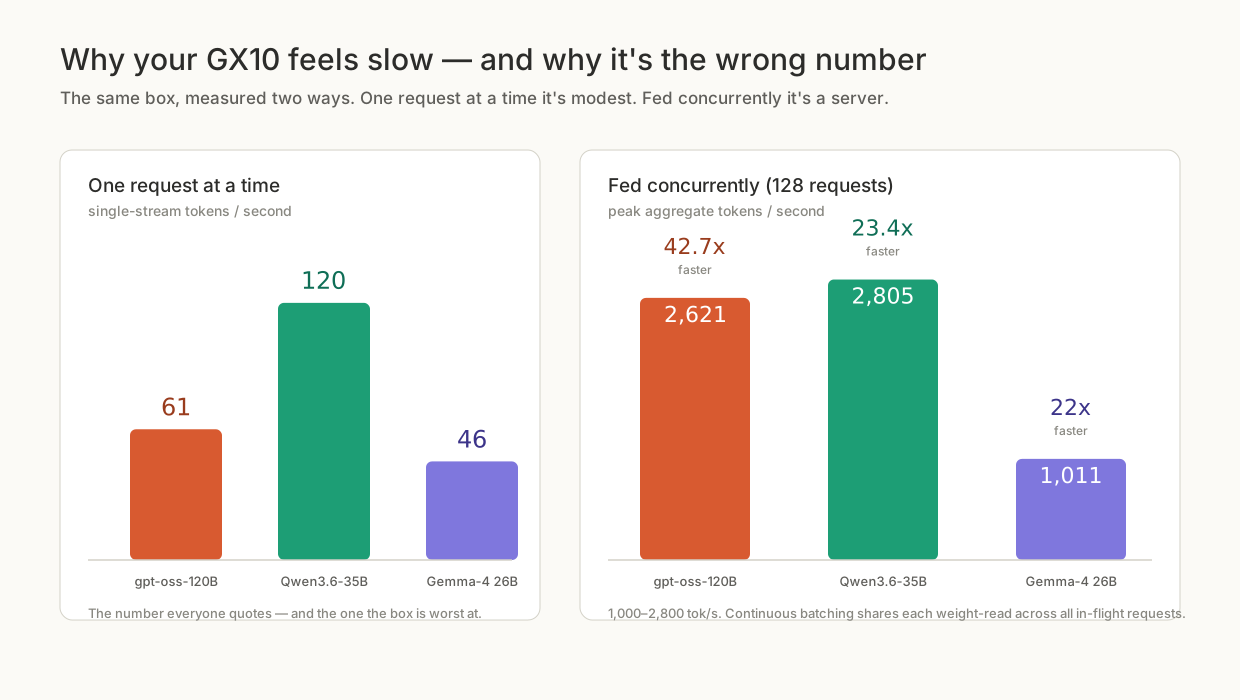
Then I stopped benchmarking it like a gaming GPU: 128 concurrent requests instead of one, same model, same silicon, and it produced 2,621 tokens a second.
I've had one of these on my desk for a month: an NVIDIA DGX Spark, the GB10 Grace-Blackwell box (also sold as the ASUS GX10), running three model stacks through our pipeline. Two hardware numbers decide everything you'll measure on this box.
The two numbers that govern everything
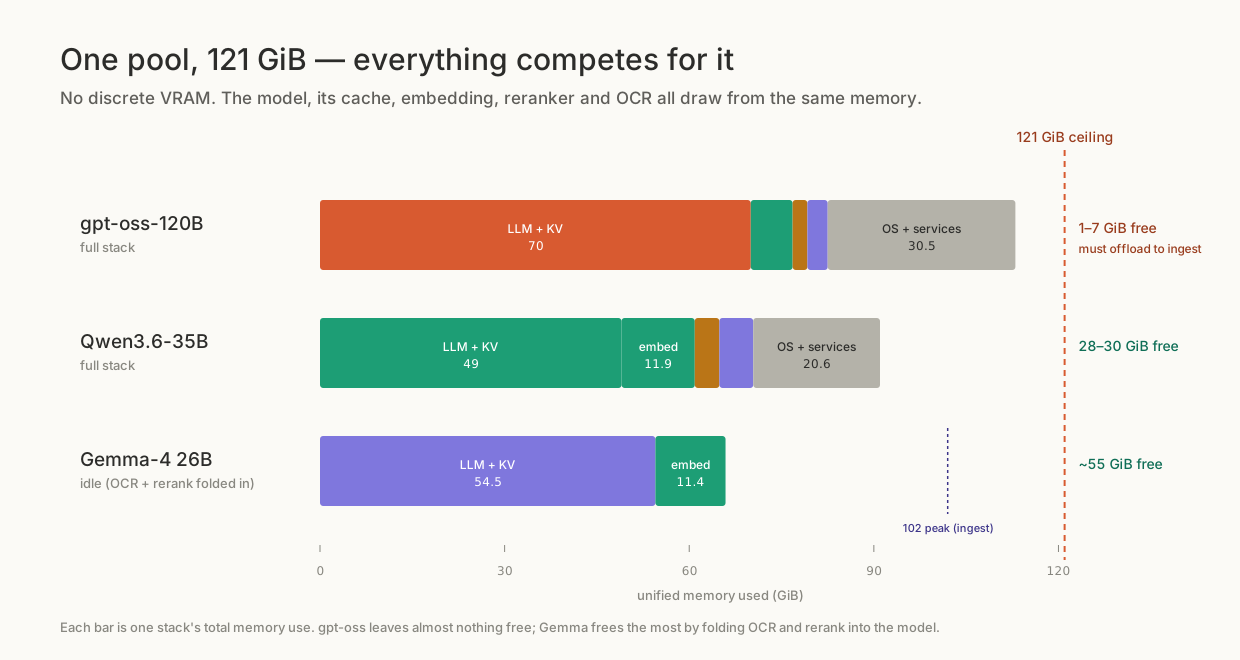
The GB10 has roughly 121 GiB of unified LPDDR5X (marketed as 128 GB), fed by about 260-273 GB/s of memory bandwidth.
The key word is unified: there's no discrete VRAM in this machine. "GPU memory" and "system RAM" are the same pool: the language model, its KV cache, embedding model, reranker, OCR model and operating system all draw on one 121 GiB budget. Run out and the box doesn't slow down gracefully, it OOM-kills your process. That's covered in "128GB of VRAM" is the most misread spec on the DGX Spark.
Why one chat feels slow
Every token a language model generates means reading all of that model's active weights out of memory, once per token. For a single request in flight, the arithmetic is simple:
tok/s ≈ memory bandwidth ÷ active bytes per tokenAt ~260 GB/s there's no trick that beats that division for one request; the GPU mostly waits on memory, not compute. The 50-61 tok/s we measured single-stream for gpt-oss-120B (61.4 tok/s in the batching run) is the ceiling that division sets, not a defect or a misconfiguration.
Active parameters, not total
The number printed on the model (120B, 35B, 26B) says little about how fast it feels on this hardware. What matters is how many parameters it reads per token.
| Model | Total params | Active/token | Quant · engine | Single-stream |
|---|---|---|---|---|
| gpt-oss-120B | 120 B | ~5 B (MoE) | MXFP4 · SGLang | 50-61 tok/s |
| Qwen3.6-35B-A3B | 35 B | ~3 B (MoE) | NVFP4 · vLLM | 80 (thinking on) / 120 (off) |
| Gemma-4 26B-A4B | 26 B | 3.8 B (MoE) | FP8-Dynamic · vLLM | 39 (FP8) / 56 (FP8 + MTP) |
| Gemma 31B dense | 31 B | 30.7 B (dense) | n/a | ~7 tok/s |
Every model that survived is a Mixture-of-Experts design, activating three to five billion parameters per token. The one dense model I tried, a 31B Gemma variant, came in bandwidth-dead at about 7 tokens a second and was disqualified on the spot. On a bandwidth-limited box, a big sparse model beats a small dense one, the opposite of the discrete-GPU instinct. More on the three survivors in Which LLM should you run on a DGX Spark?
Batching defeats the bandwidth wall
That bandwidth limit is a single-request artefact. When many requests decode at once, the GPU reads each chunk of weights once and reuses it across every sequence in flight, amortising the bandwidth cost. That's continuous batching, the reason a box like this exists.
| Model | Single user (N=1) | Peak aggregate (N=128) | Gain |
|---|---|---|---|
| gpt-oss-120B | 61.4 tok/s | 2,621 tok/s | 42.7x |
| Qwen3.6 (thinking off) | 119.9 tok/s | 2,805 tok/s | 23.4x |
| Gemma-4 FP8 + MTP | 46 tok/s | 1,011 tok/s | ~22x |
The slowest single-stream model gains the most from batching: it had the most idle memory-wait time to reclaim. gpt-oss-120B is the worst model for one impatient human and the best for a hundred concurrent requests.
57 tok/s is a single-stream measurement. Fed concurrently, the same box is a 1,000-2,800 tok/s machine.
Where the curve stops climbing
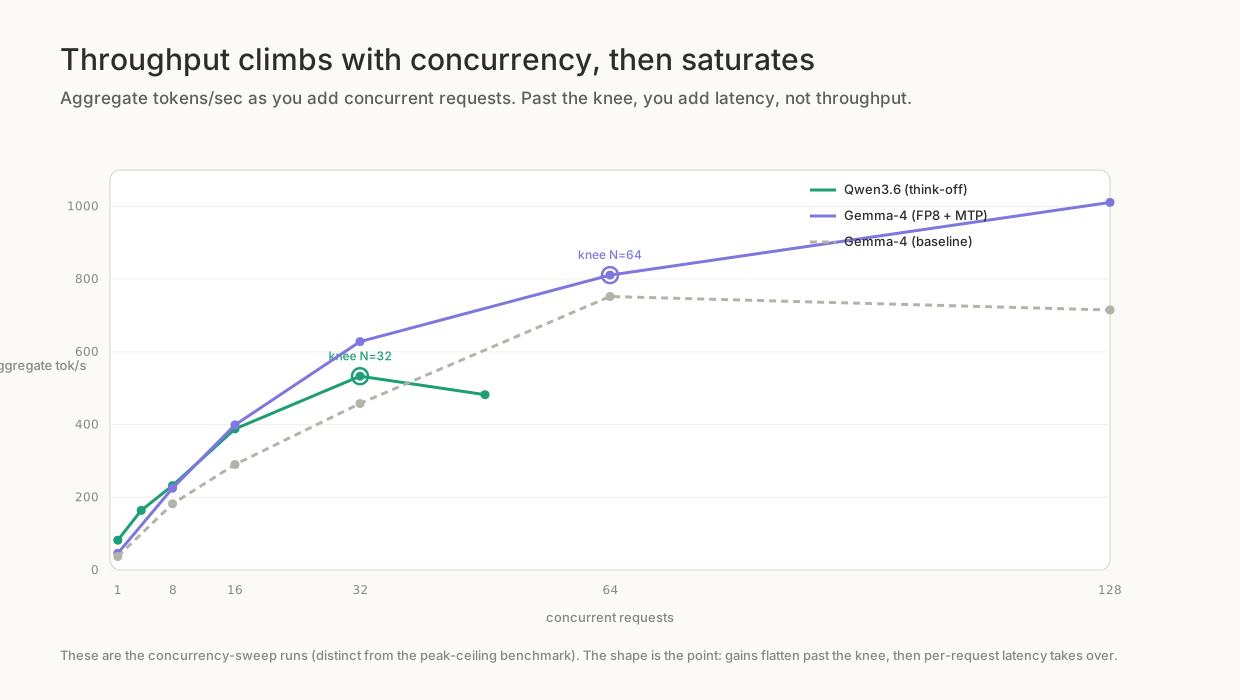
The gains aren't infinite. Qwen3.6 with thinking off runs 82, 164, 232, 388 and 533 aggregate tok/s at concurrency 1, 4, 8, 16 and 32, then drops to 482 at 48: its ceiling is N=32. Gemma-4 with MTP runs 46, 225, 399, 628, 811 and 1,011 at 1, 8, 16, 32, 64 and 128, beating its non-speculative baseline throughout, but the practical knee is N=64, where p95 time-to-first-token (TTFT) is still under a second. Push to 128 and TTFT blows out to 20-28 seconds for that last 25%.
One clarification: Gemma's 46 tok/s single-stream figure is the N=1 point behind the ~22x multiplier; the 56 tok/s figure comes from dedicated speculative-decoding testing (MTP at k=4 took Gemma from 39.4 to 56.2 tok/s, a free +43% at 47% draft acceptance, no quality loss). MTP is FP8-only, so factor that into your quantisation choice.
Throughput, not latency
The 42.7x headline invites a misreading. Batching wins throughput. It doesn't win latency. No individual request finishes faster under load; most finish slower, because they're sharing the box.
Gemma going from one stream to 64 concurrent buys 17.6x the aggregate throughput at roughly 3.6x the per-request latency: a 256-token response that took 5.7 seconds alone takes about 21 seconds in the crowd. TTFT moves the same way, from 0.14 s to ~1.3 s at Gemma's N=64 sweet spot, and from 4.8 s to 63 s for Qwen at N=1 versus N=128. Per-token decode time holds up better: 6-7 ms batched for gpt-oss, 17.4 ms for Gemma with MTP against 24.9 ms without. The queue is real.
It's the right trade for a serving backend, a RAG pipeline or an ingest queue, not for one person watching a cursor blink. Pick your concurrency for the workload you have, not the biggest number in the chart.
What to set
The three configurations we settled on, after a month of breaking things:
| Use case | Model | Configuration |
|---|---|---|
| Accuracy-critical batch | gpt-oss-120B | Offload non-essential services, extraction workers at 8, ordered model load on boot, LLM_MEM_FRACTION 0.64 |
| Production default | Qwen3.6-35B | Thinking OFF, max-num-seqs 32, extraction workers 16, OCR workers 8, merge worker 1 (overlapping data) or 4 (diverse) |
| Full consolidation | Gemma-4 26B FP8+MTP | max-num-seqs 64, OCR workers 8x8, extraction workers 6 with MAX_ASYNC 8, vision on, pin a specific vLLM digest |
# vLLM - Qwen3.6-35B-A3B (NVFP4)
--max-num-seqs 32                 # match this to your worker fan-out
--gpu-memory-utilization 0.45     # fraction of TOTAL memory

# vLLM - Gemma-4 26B-A4B (FP8-Dynamic, MTP k=4)
--max-num-seqs 64

# SGLang - gpt-oss-120B (MXFP4)
--mem-fraction-static             # fraction of memory FREE AT STARTUP
LLM_MEM_FRACTION=0.64             # 0.58 was the cliff that 400'd every extraction call
Those last two lines cost me a weekend. SGLang's --mem-fraction-static is a fraction of memory free at startup; vLLM's --gpu-memory-utilization is a fraction of total. Load models serially and each one sees less free memory than the last, so it needs a larger fraction, not a smaller one. Getting those two backwards is what SIGKILLed gpt-oss on boot, repeatedly. While you're in there, provision at least 48 GiB of swap: gpt-oss's 61 GB of weights briefly double-buffer to about 115 GB during load, and swap gives that spike somewhere to spill instead of dying. More levers, with before and after numbers, in Seven levers that took a DGX Spark from "won't boot" to 2,800 tokens a second.
What the box is for
As a single-chat device it's disappointing. As a server for a team, a RAG pipeline, an agent fleet or a document-ingestion backend, anything with concurrent load, it's a serious little box that fits on a desk.
The batching story above is a decode story, and document ingestion isn't decode-bound. During a full ingest run the GPU sits at 96% on prefill, and generation never gets near that 1,011 tok/s ceiling. The decode levers (speculative decoding, bigger max-num-seqs) win the chat path and do close to nothing for ingest, which has its own levers. That's Most people tuning local LLMs optimise the wrong half of the problem.
How this was measured
Everything here comes off one physical box, instrumented with Prometheus and the DCGM GPU exporter feeding Grafana, so the utilisation and memory figures are real telemetry, not guesses. Throughput came from concurrency sweeps against each engine; memory figures are steady-state readings with the full stack loaded. This compares speed and memory, where the three stacks diverge; answer quality was measured separately on a 49-question test set (79.6% / 93.9% / 91.8%) and belongs to the model comparison, not this one. The documents-per-hour figures in the wider study aren't yet a clean three-way comparison: only the Gemma run was driven to completion, the other two are projections from measured per-document rates.
This matters to me commercially: Certant runs where the compliance team says, sometimes fully air-gapped, for organisations whose documents can't leave the building. That makes "how much can one appliance do" a product question, not a hobby one.