Most people tuning local LLMs optimise the wrong half of the problem
A full 50-document ingest pinned the GPU at 96% for 38 minutes, on prefill, not decode, while the celebrated decode levers barely moved throughput.
A full 50-document ingest pinned the GPU at 96% for 37.8 minutes. That's the most useful thing I learned benchmarking a DGX Spark, and I learned it the slow way, by pulling every celebrated decode lever first while my documents-per-hour number refused to move.
Document ingestion is prefill-bound, and the famous "make it faster" tricks barely touch it. The GPU stayed saturated the whole run, no idle gaps, roughly zero preemptions, but on prefill, not decode. Generation sat at 220 to 264 tokens a second, against a measured batched decode ceiling of 1,011 tok/s for the same model on the same box. It was flat out while using about a quarter of its decode capacity.
For calibration, the hardware is one NVIDIA DGX Spark (ASUS GX10, same GB10 Grace-Blackwell box; from here, "DGX Spark"), with ~121 GiB unified LPDDR5X shared CPU/GPU. For why a single chat feels slow on this hardware, see Your DGX Spark isn't slow. You're testing it wrong.
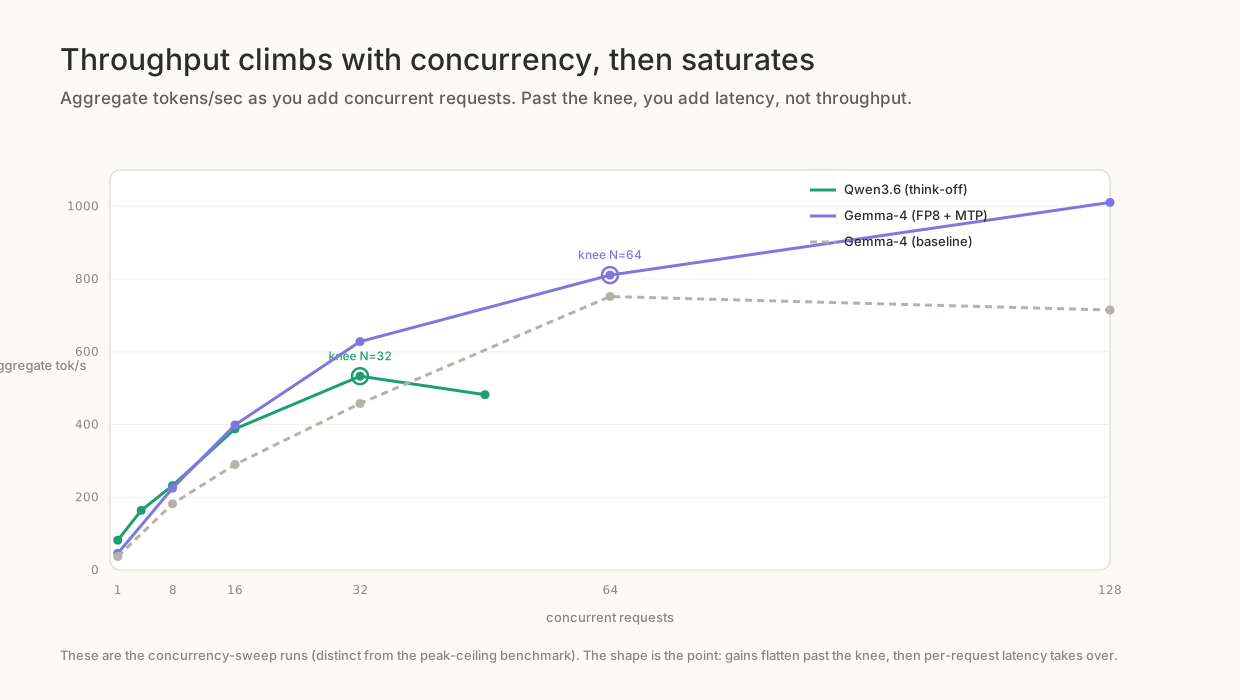
Aggregate throughput climbs to 1,011 tok/s for Gemma-4 with MTP at 128 concurrent requests, knee at 64; Qwen3.6 with thinking off peaks near 533 tok/s at its N=32 knee. The ingest run held 220 to 264 tok/s, nowhere near this curve.
Prefill and decode, in plain English
Every request has two phases. Prefill reads the prompt in, one parallel matrix multiply over every input token, compute-heavy and scaling with how much text or how many image tokens you handed over. Decode writes the answer out one token at a time, bound by memory bandwidth (~260 to 273 GB/s here), which is why a chat window shows 50 to 120 tokens a second, model dependent.
Most writing on local LLM performance is about decode, because most benchmarks are a chat window. Change the workload and the ratio inverts.
| Chat / query | Document ingest | |
|---|---|---|
| Input per call | a question plus a few retrieved chunks | a page image (thousands of vision tokens), or a 1 to 3K-token chunk plus an extraction prompt |
| Output per call | a long, free-form answer | a short, structured list of entities and relations |
| Calls per unit of work | one per question | ~200 LLM calls per document at ~100 chunks, gleaning 1 |
| Dominant phase | decode | prefill |
| Levers that move it | speculative decoding, max-num-seqs, KV cache |
worker concurrency, extraction-tail parallelism, prefilling less text |
What each workload spends its GPU time on, and which levers actually move it.
38 minutes of pinned GPU, nowhere near the decode ceiling
The run: 50 numbered legal agreements through the full pipeline (OCR, embed, graph-extract, merge), one Gemma-4 26B-A4B model for chat, OCR and reranking, Qwen3-Embedding-4B for vectors. Fifty of fifty in 37.8 minutes: 79.4 documents an hour, peak LLM batch 62 of 64, peak unified memory 102 GiB of 121, CPU peaking at 51%, never the bottleneck. Both regimes are prefill.
| Phase | Wall | Avg batch | Prefill tok/s | Gen tok/s | GPU | Bound by |
|---|---|---|---|---|---|---|
| OCR / vision | 0 to 19.2 min | 32 | 1,032 | 220 | 94% | image prefill, each page is thousands of vision tokens |
| Extraction tail | 19.2 to 37.8 min | 9 | 1,394 | 264 | 95% | chunk-context prefill, plus per-knowledgebase merge serialisation |
Both phases of the 50-document Gemma-4 run, from the Grafana dashboard and worker logs.
Prefill throughput is five to six times generation throughput in both phases; generation never gets within a factor of four of the 1,011 tok/s decode ceiling.
Document ingestion is prefill-bound, not decode-bound. All the famous decode tricks, speculative decoding, bigger batch sizes, win the chat path. They do almost nothing for ingest.
The two lever families
Decode levers, which win the query path
I use all of these. Multi-Token Prediction (MTP) speculative decoding at k=4 took Gemma-4 26B FP8-Dynamic from 39.4 to 56.2 tok/s single-stream, a free +43%, lossless, at ~47% acceptance (per drafted position: 75 / 52 / 35 / 26%). DFlash at k=15 managed only 8% acceptance, below the no-speculation baseline, tuned for code-like streams, not RAG prose. It's also FP8-only here; vLLM's NVFP4 path doesn't implement tie_weights.
max-num-seqs matters as much: shipped at 16, it pinned aggregate throughput to ~290 tok/s; raised to 64, it opened up the 750 to 1,011 tok/s range. A 3x on the serving path, and I wouldn't run without it.
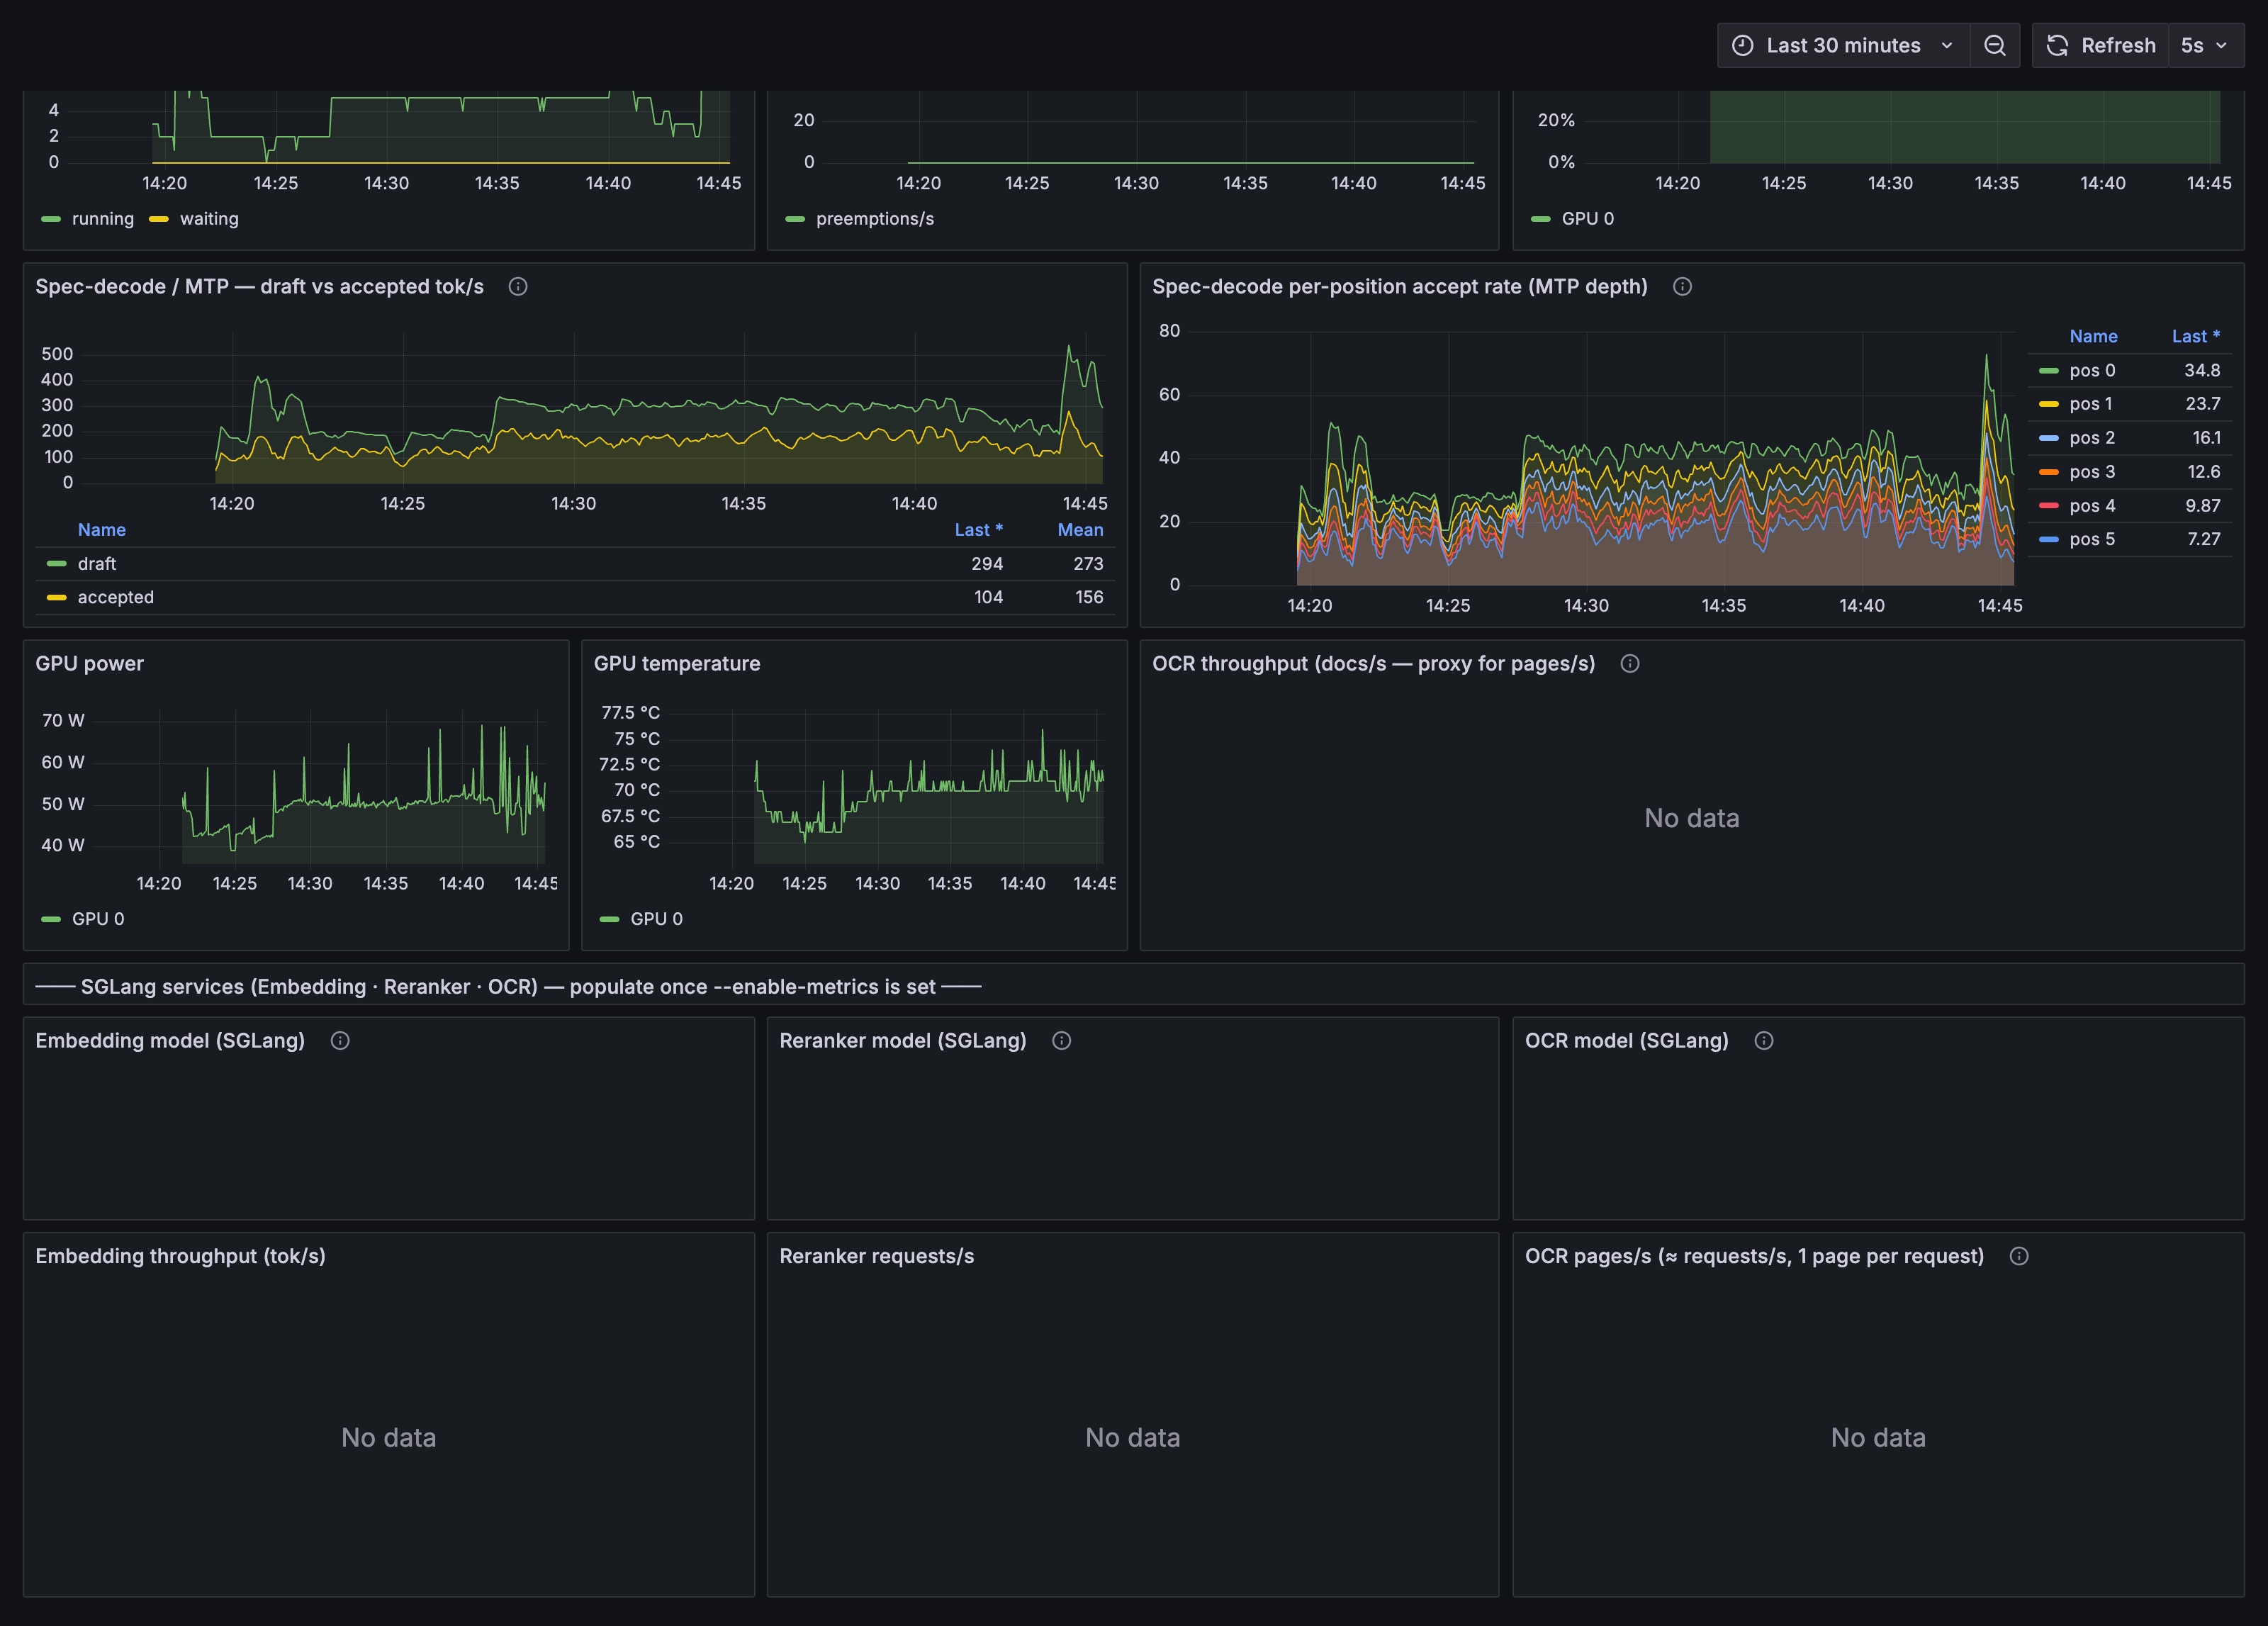
The decode panels everyone tunes: drafted tokens (mean 273/s) against accepted (mean 156/s), acceptance decaying with each extra drafted position, 34.8% at the first, 7.3% by the sixth.
During the ingest run, speculative decoding worked exactly as advertised and still barely moved the needle. MTP acceptance: ~98% through OCR, where the model emits structured markdown; ~80% through extraction. There was almost no decode to accelerate.
Prefill levers, which win the ingest path
Worker concurrency: make rag_worker × MAX_ASYNC land near max-num-seqs (on Qwen3.6, a 32-sequence cap is 4 workers times 8 async calls). Past that you buy queuing, memory pressure, database contention and tail latency, not throughput.
Extraction-tail parallelism: in the 50-doc run the tail averaged a batch of 9 out of 64, against 48 configured concurrent calls. The missing 39 queued behind graph merges, not the GPU.
Prefilling less text: lower the page render DPI for fewer vision tokens per page, tighten the extraction context for less prefill per call, drop the gleaning depth for fewer calls per document, each a direct cut to GPU compute traded against quality.
OCR was the clearest example: 166 seconds a document, GPU idle between pages thanks to a client-side max_workers=1, correct for the old single-stream OCR server, wrong for a batching vision one. Fixing it took OCR from 166 to 110 s/doc, in-flight requests from 4 to 57, GPU utilisation from idle to 96%, about 2.5x on the OCR phase. End to end it bought roughly 10%, 72 to 79 docs/hr. Removing the OCR bottleneck just exposed the extraction and merge tail as the new one.
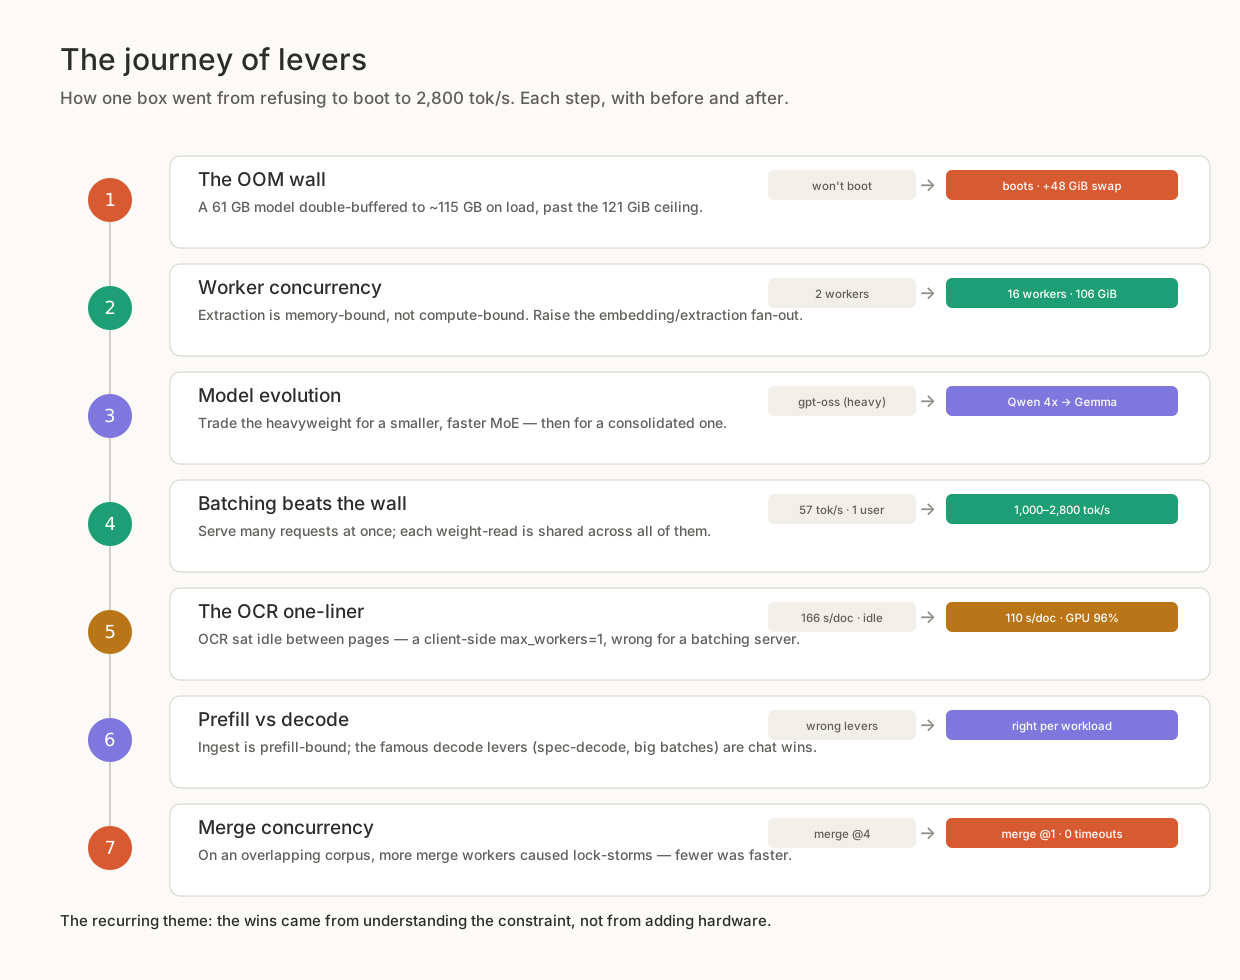
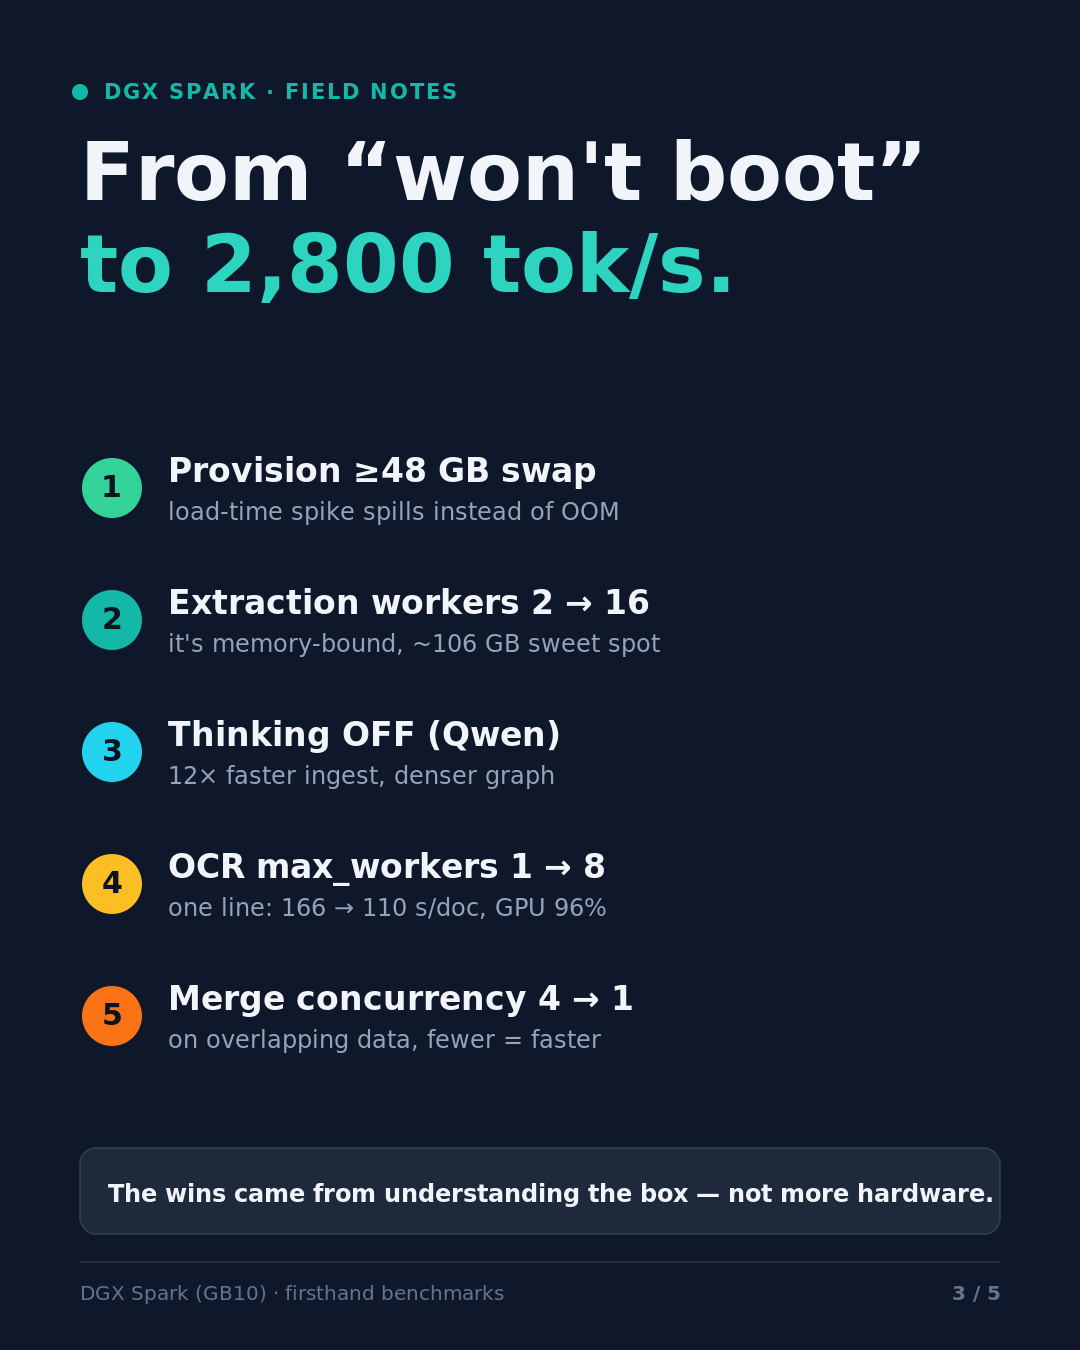
Seven levers, two of them the ingest ones: the OCR client fix (166 to 110 s/doc, GPU idle to 96%) and merge concurrency (merge@4 to merge@1, 217 lock timeouts to zero). Full run-through in Seven levers that took a DGX Spark from "won't boot" to 2,800 tokens a second.
What happened when I cranked everything anyway
I didn't believe the prefill story at first: the extraction tail showed an under-filled decode batch, 14 to 24 running, zero waiting, KV cache at 22%, reading like 2x of headroom. I spent a night pushing every knob toward the ceiling on a 100-document corpus.
| Config | OCR phase | End to end | vLLM batch | Merge lock timeouts | Memory |
|---|---|---|---|---|---|
Baseline: ocr 16 / rag 24 / merge 8, max-num-seqs 64, gpu-mem 0.45 |
17.7 min, 339 docs/hr | 70.4 min, 85.2 docs/hr | 14 to 24 running, 0 waiting | 0 | 96 GiB |
| merge 8 to 16 | on track, ~17 min | stopped early | 64/64 full, waiting to 114 | bursts to 28 | 96 GiB |
+ max-num-seqs 64 to 160, gpu-mem 0.45 to 0.55 |
26 of 100 docs in 13 min (~3x slower) | thrashed | 160 full, waiting 42 | 0 | 113 GiB |
Overnight sweep on a 100-document corpus, from the deployment-efficiency run logs.
The GPU was compute-saturated at max-num-seqs=64 on prefill, from the long vision and extraction prompts. Raising the decode batch to 160 added no throughput: it over-committed 160 concurrent heavy prefills plus their KV and worker memory, pushed the box to 113 GiB, and slowed OCR about 3x. The "zero waiting, KV 22%" headroom I'd been staring at was a decode-batch reading.
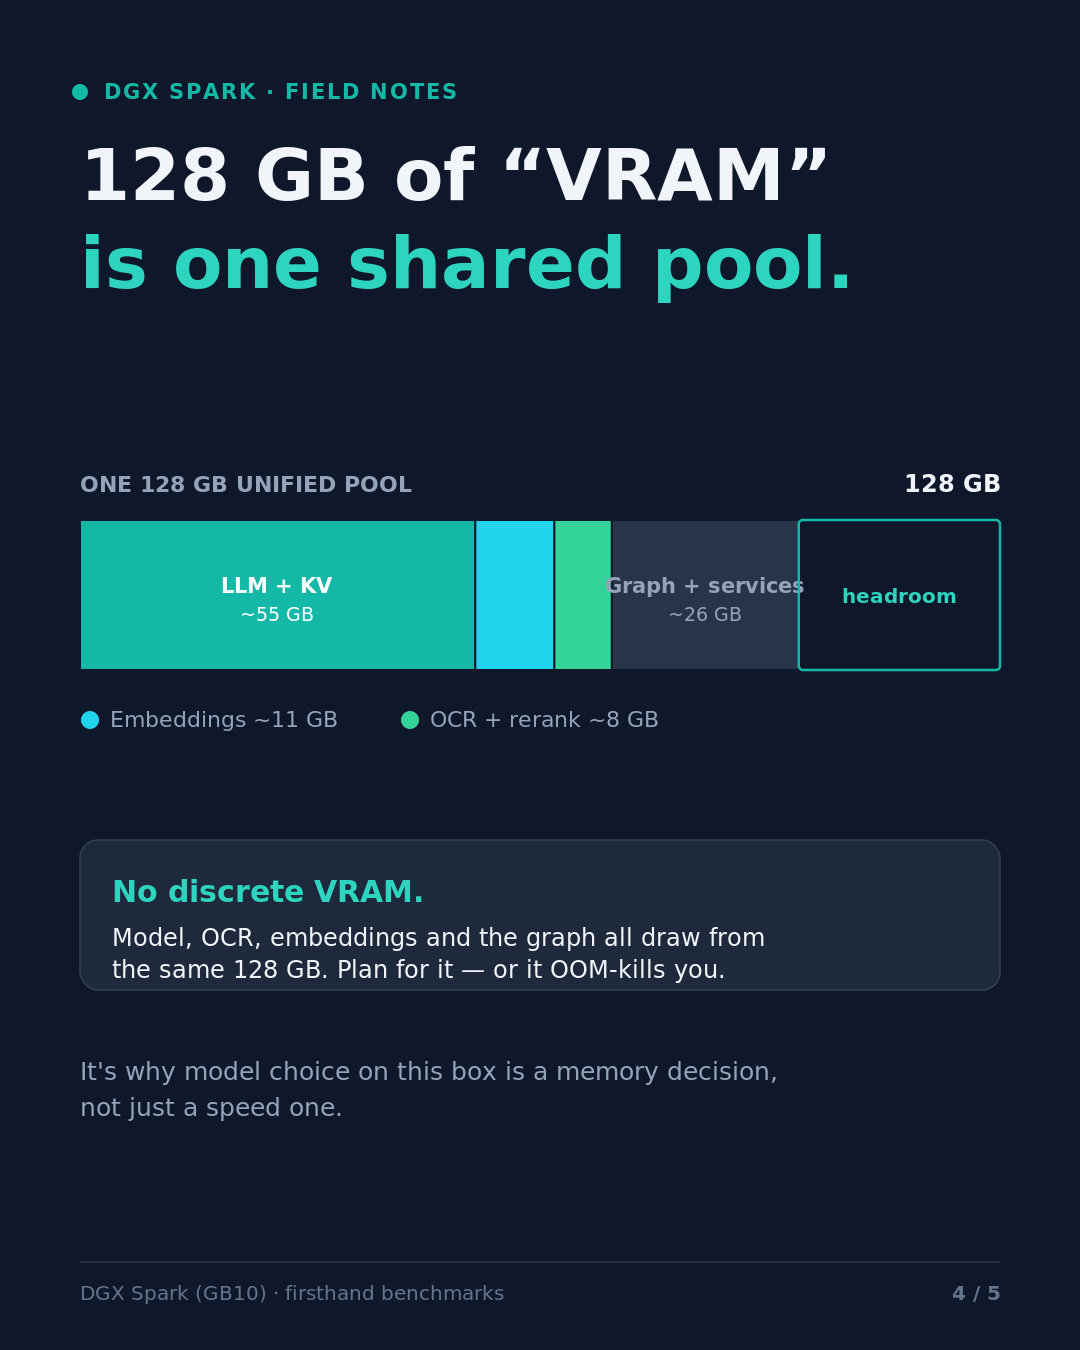
gpu-memory-utilization was only 0.45; the unused memory just doesn't convert to ingest throughput. (Memory is its own trap, see "128GB of VRAM" is the most misread spec on the DGX Spark.)
Merge concurrency: more workers, more lock timeouts
On a highly overlapping corpus, HR and remuneration documents where every file mentions "Base Salary" and "Superannuation Guarantee", merge at concurrency 4 produced 217 lock-timeout events and merged 9 of 100 documents in 40 minutes. At concurrency 1: zero timeouts, merge kept pace with extraction. (217 counts log lines, not distinct entities, roughly an order of magnitude.)
Each entity merge takes a per-entity lock spanning read, summary and write; an edge merge takes three locks (both endpoints, the edge), so one hot entity blocks every merge touching it. The summary call inside that lock can't be batched: single-stream speed, ~71 to 80 tok/s, not the 2,000+ tok/s aggregate the server advertises. Enough holds queue up and a waiter blows its 120-second acquire budget without any single holder exceeding it.
Point the same corpus and code at a fast hosted model, summaries about a second each, and merge concurrency 10 runs clean: zero timeouts, 100 of 100 merged. Higher concurrency, better result: concurrency was never the cause. A slow LLM held inside a lock is, multiplying one long hold into a queue of waiters. The setting is shaped by your data, not your box: merge at 1 for an overlapping single-knowledgebase load, 4 for diverse or multi-tenant ones. Merge@1 is a workaround; the fix is getting the LLM out of the lock and summarising out of band.
What to actually set if your box spends its day ingesting
This is the configuration that produced 85.2 docs/hr on the 100-document corpus:
# vLLM server (Gemma-4 26B-A4B FP8-Dynamic + MTP k=4, vision enabled)
--max-num-seqs 64
--gpu-memory-utilization 0.45

# pipeline workers
OCR_WORKER_CONCURRENCY=16
RAG_WORKER_CONCURRENCY=24
MAX_ASYNC=16
GLMOCR_PIPELINE_MAX_WORKERS=8      # the one-line OCR fix; never leave this at 1
graph_merge_worker --concurrency=8 # drop to 1 if every document shares the same entities
On Qwen3.6-35B the equivalent recipe: thinking off (thinking-on was 12x slower during ingest, sparser graph), max-num-seqs 32, extraction workers at 16, OCR workers at 8, merge at 1 for overlapping data. For which of the two you want, see a separate argument.
| If the box spends its day… | Tune this | Leave this alone |
|---|---|---|
| Answering queries and chat | speculative decoding (MTP k=4), max-num-seqs, KV headroom |
worker fan-out |
| Ingesting documents | worker concurrency until the batch fills, merge concurrency matched to your data's shape, prefill per page (render DPI, context length, gleaning depth) | max-num-seqs past saturation, gpu-memory-utilization |
Which knobs matter for which workload, drawn from the runs above.
On one GB10, ~85 documents an hour is close to the physical limit here. The remaining levers: less work per document, fewer prefill tokens per page, or a second device. Bigger caps and more workers won't move it, as the thrashed overnight run showed.
How this was measured: the same box, instrumented with Prometheus, node-exporter and DCGM feeding Grafana, per-stage timings from worker logs. Speed, memory and operational cost only, no accuracy claims: the 49-question accuracy evaluation across the three models lives in the model-comparison article. Documents-per-hour is within-run, not a cross-stack score, since the 50-document and 100-document loadtest100 runs use different corpora and code versions.
Certant deploys where the compliance team says it has to live: cloud, on-prem, or fully air-gapped, often onto hardware like a DGX Spark. There, "how many documents can we load overnight" is answered by prefill compute and merge behaviour, not the model card's tokens-per-second figure. I found the same thing when I moved from Ollama to vLLM on far smaller GPUs, the same phase-first framing applied there too.