Seven levers that took a DGX Spark from won't boot to 2,800 tokens a second
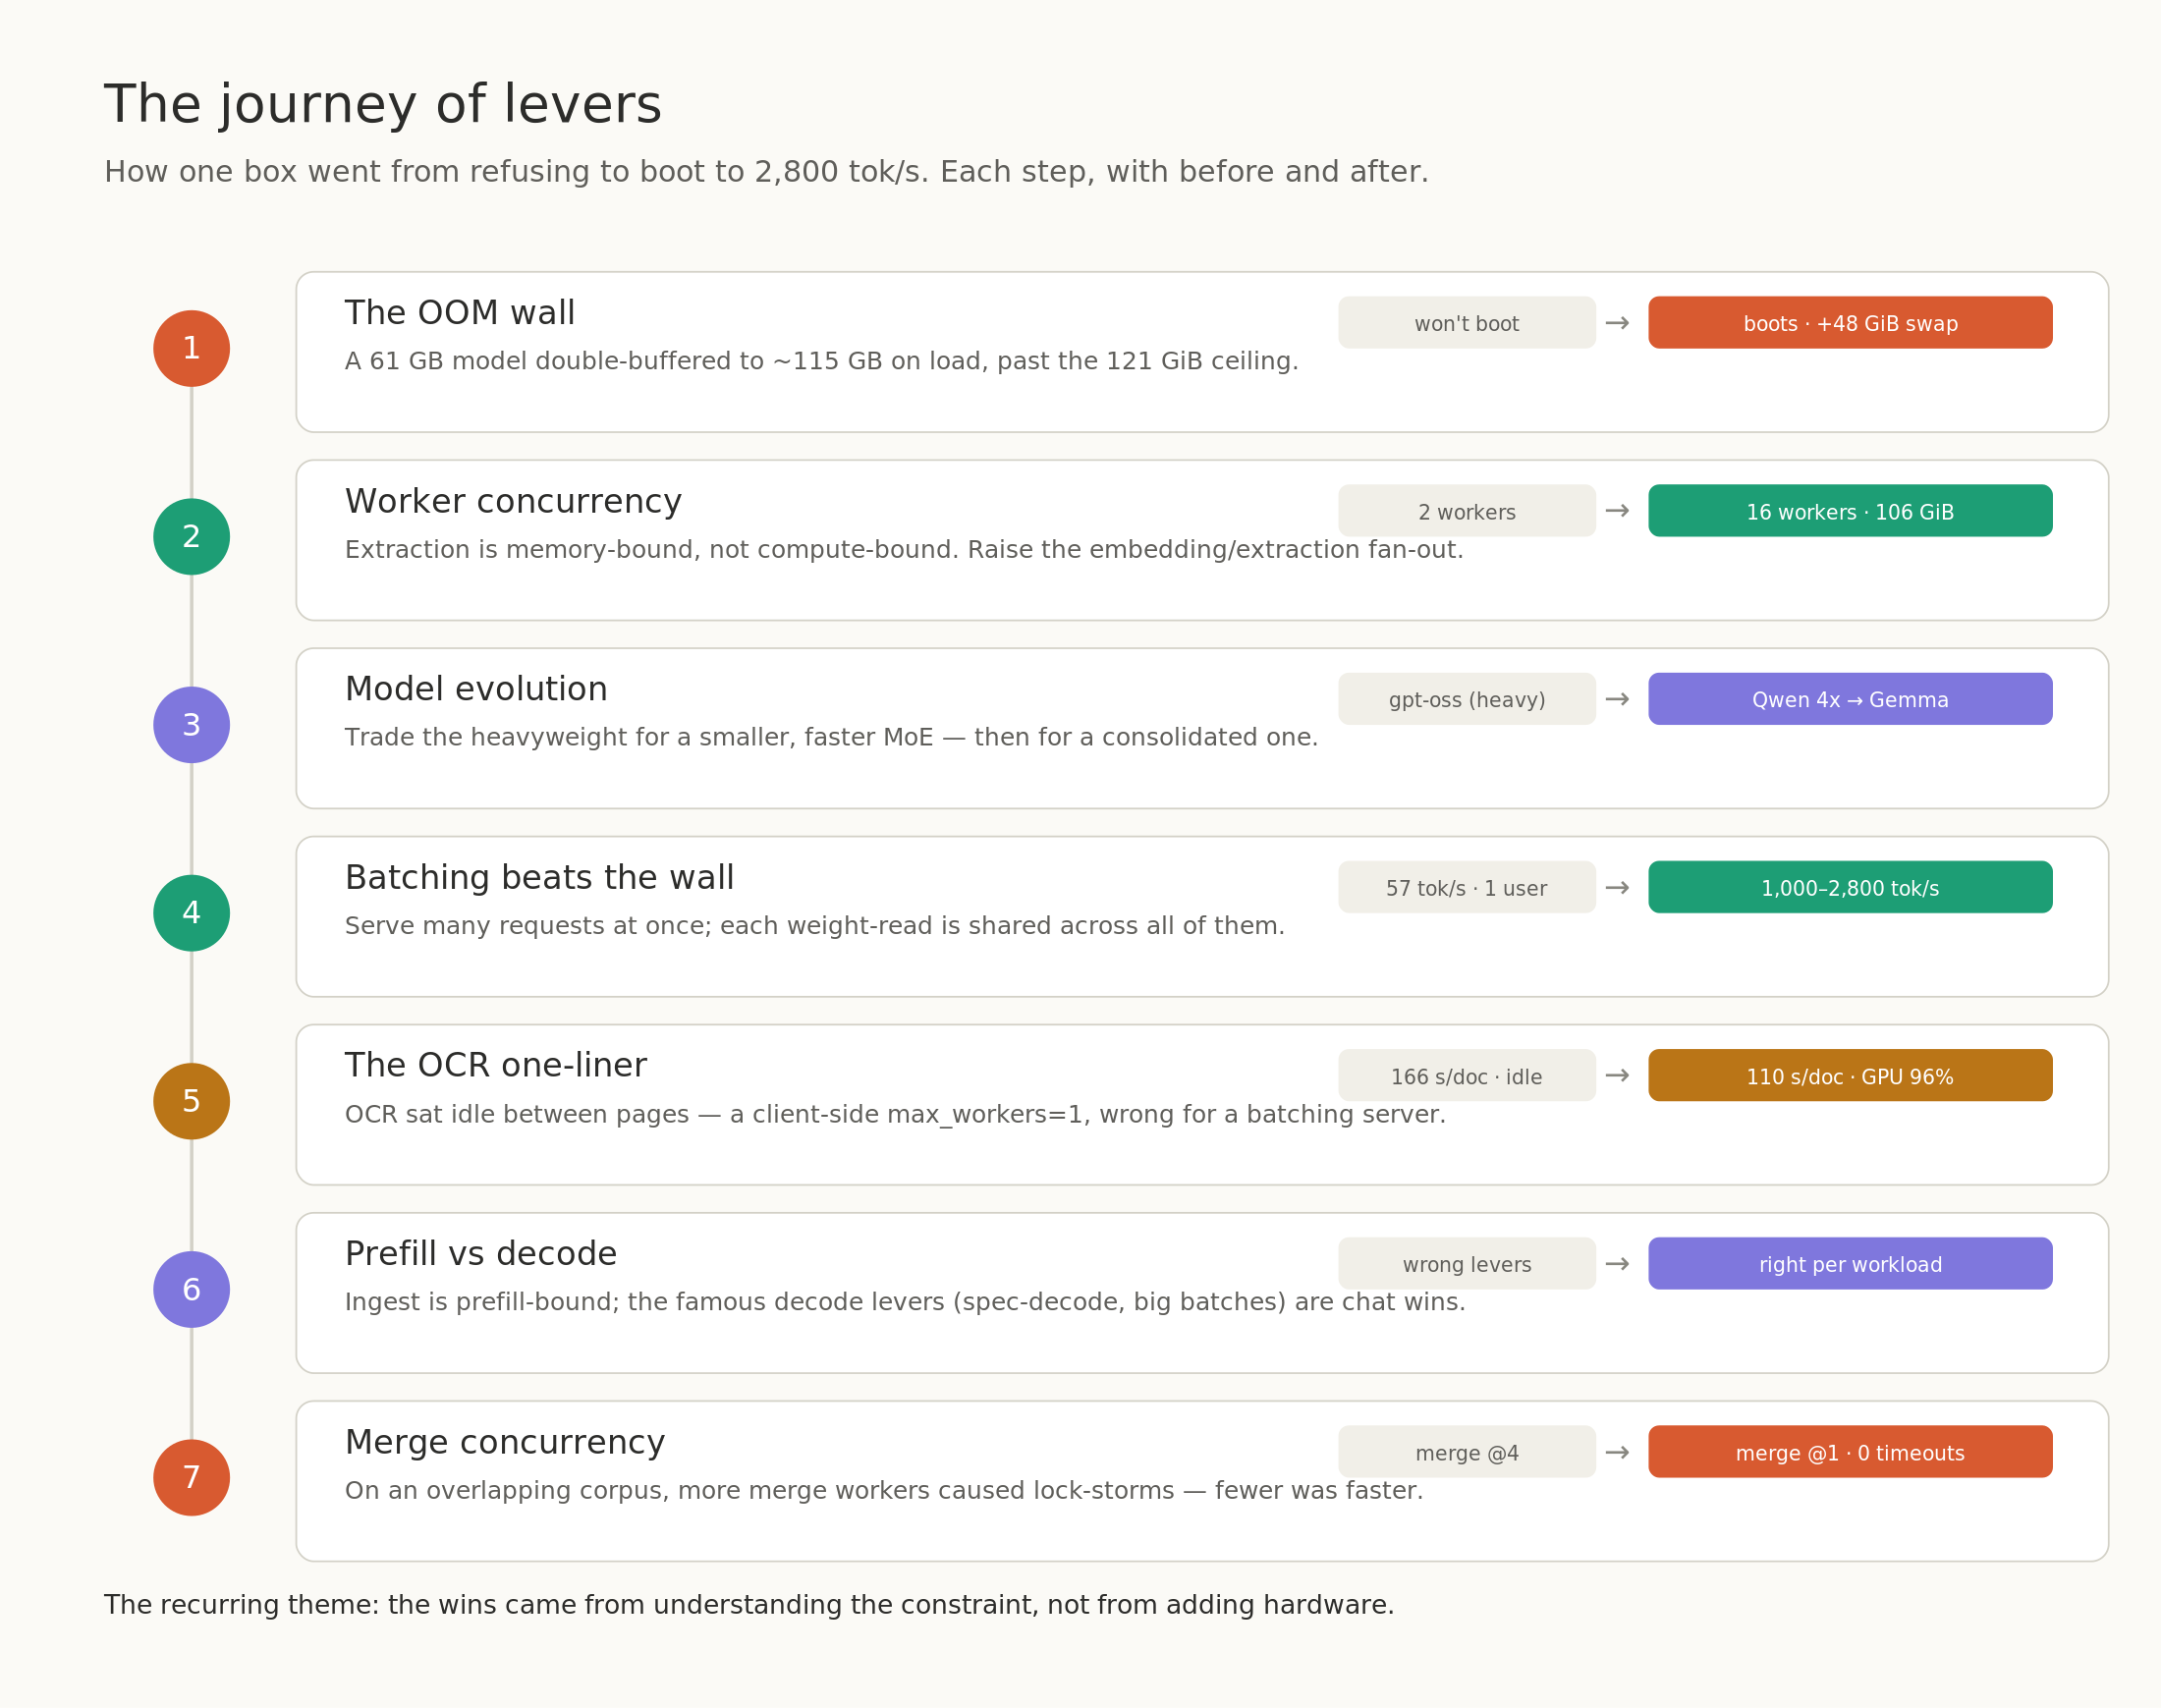
Seven config changes took my DGX Spark from OOM-killing itself on boot to 2,800 tokens a second, measured before and after.
My DGX Spark went from "won't even boot" to 2,800 tokens a second. None of the seven fixes was "buy more hardware".
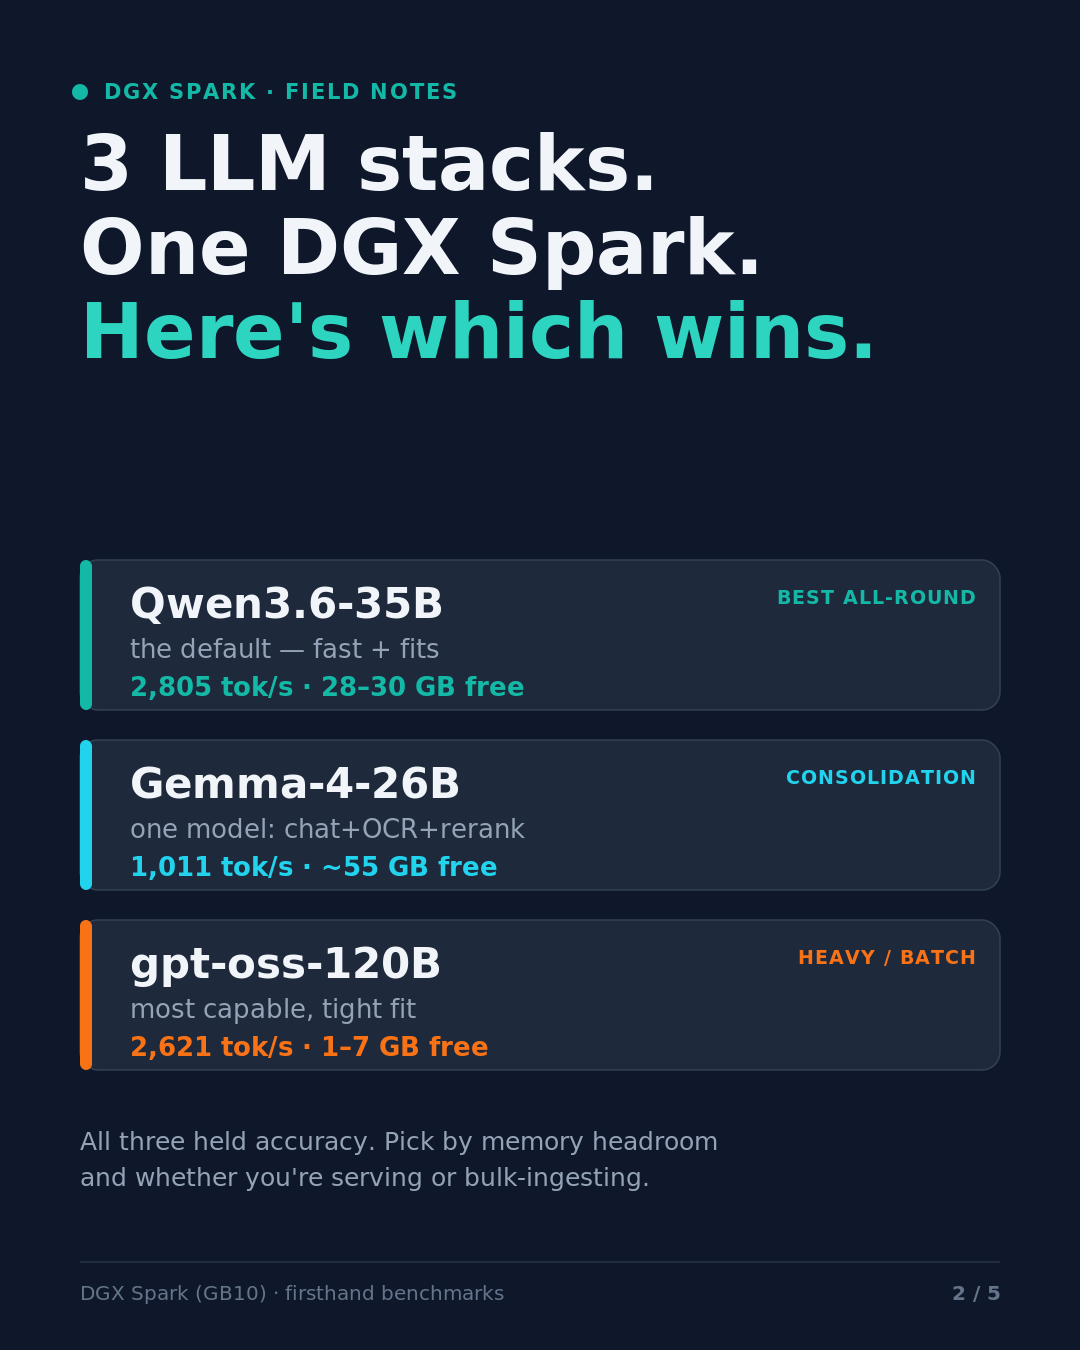
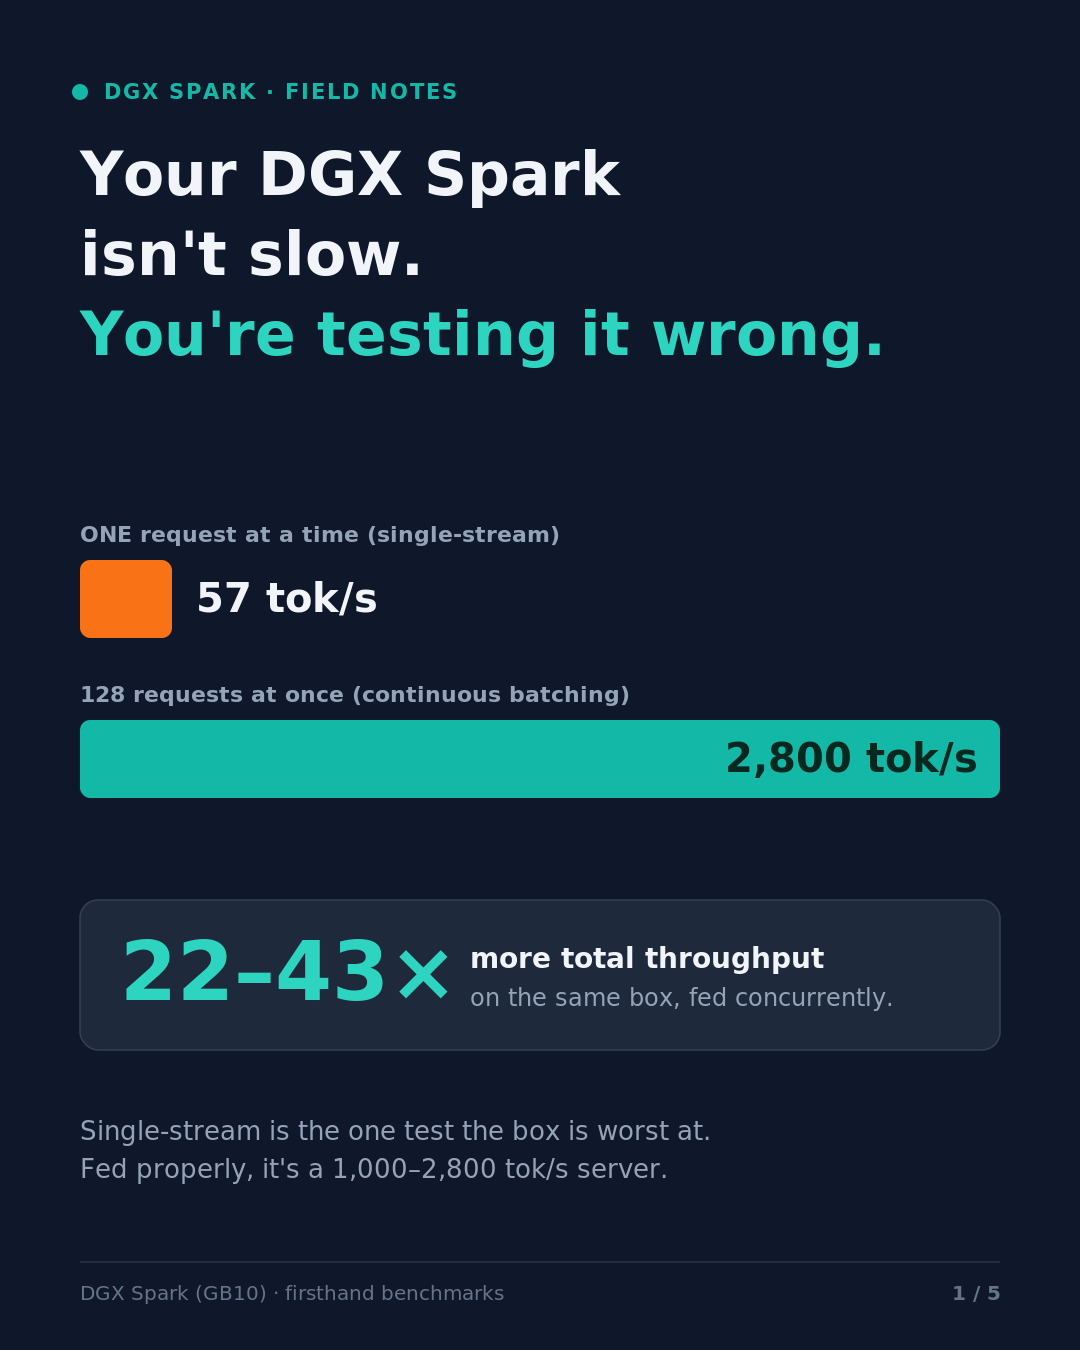
"Won't boot" is literal: my first stack (gpt-oss-120B on SGLang, plus OCR, embedding and reranker models) OOM-killed during weight load, Exited 137. And 2,805 tok/s is Qwen3.6-35B-A3B's aggregate across 128 concurrent requests, not one chat stream at ~120 tok/s. If that's new, start with Your DGX Spark isn't slow. You're testing it wrong.
The box: an NVIDIA DGX Spark (also sold as the ASUS GX10), GB10 Grace Blackwell, ~121 GiB of unified LPDDR5X (marketed as 128 GB) at ~260 to 273 GB/s, no discrete VRAM (see "128GB of VRAM" is the most misread spec on the DGX Spark).
Memory: swap for boot, workers for throughput
1. Provision at least 48 GiB of swap (won't boot, then boots)
gpt-oss-120B's weights are about 61 GB, but during load they're briefly resident twice: ~60 GB in the pool plus ~55 GB of host staging, near 115 GB against a 121 GiB budget. The stock 16 GB of swap couldn't absorb that, so the kernel killed the biggest process at 120 GiB used. I'd quoted this model at about 70 GB:
| What I'd been quoting | Measured | |
|---|---|---|
| LLM steady state | ~70 GB | ~70 GB |
| LLM peak during load | ~75 GB | 110-120 GB |
I'd missed the load-phase transient by 40 to 50 GB. The fix: a 64 GiB swapfile (79 GiB total) with vm.swappiness=100. Weights then took 420 seconds to load, spilling to swap but stable. One trap: SGLang's --mem-fraction-static is a fraction of memory free at startup; vLLM's equivalent (below) is a fraction of total, so serially loaded servers need larger fractions.
vm.swappiness = 100
# plus a swapfile of at least 48 GiB persisted in /etc/fstab
# (this box ran 64 GiB, for 79 GiB of swap total)

# SGLang: --mem-fraction-static is x memory FREE AT STARTUP, not x the 121 GiB total.
LLM_MEM_FRACTION=0.64
EMBED_MEM_FRACTION=0.30
RERANK_MEM_FRACTION=0.15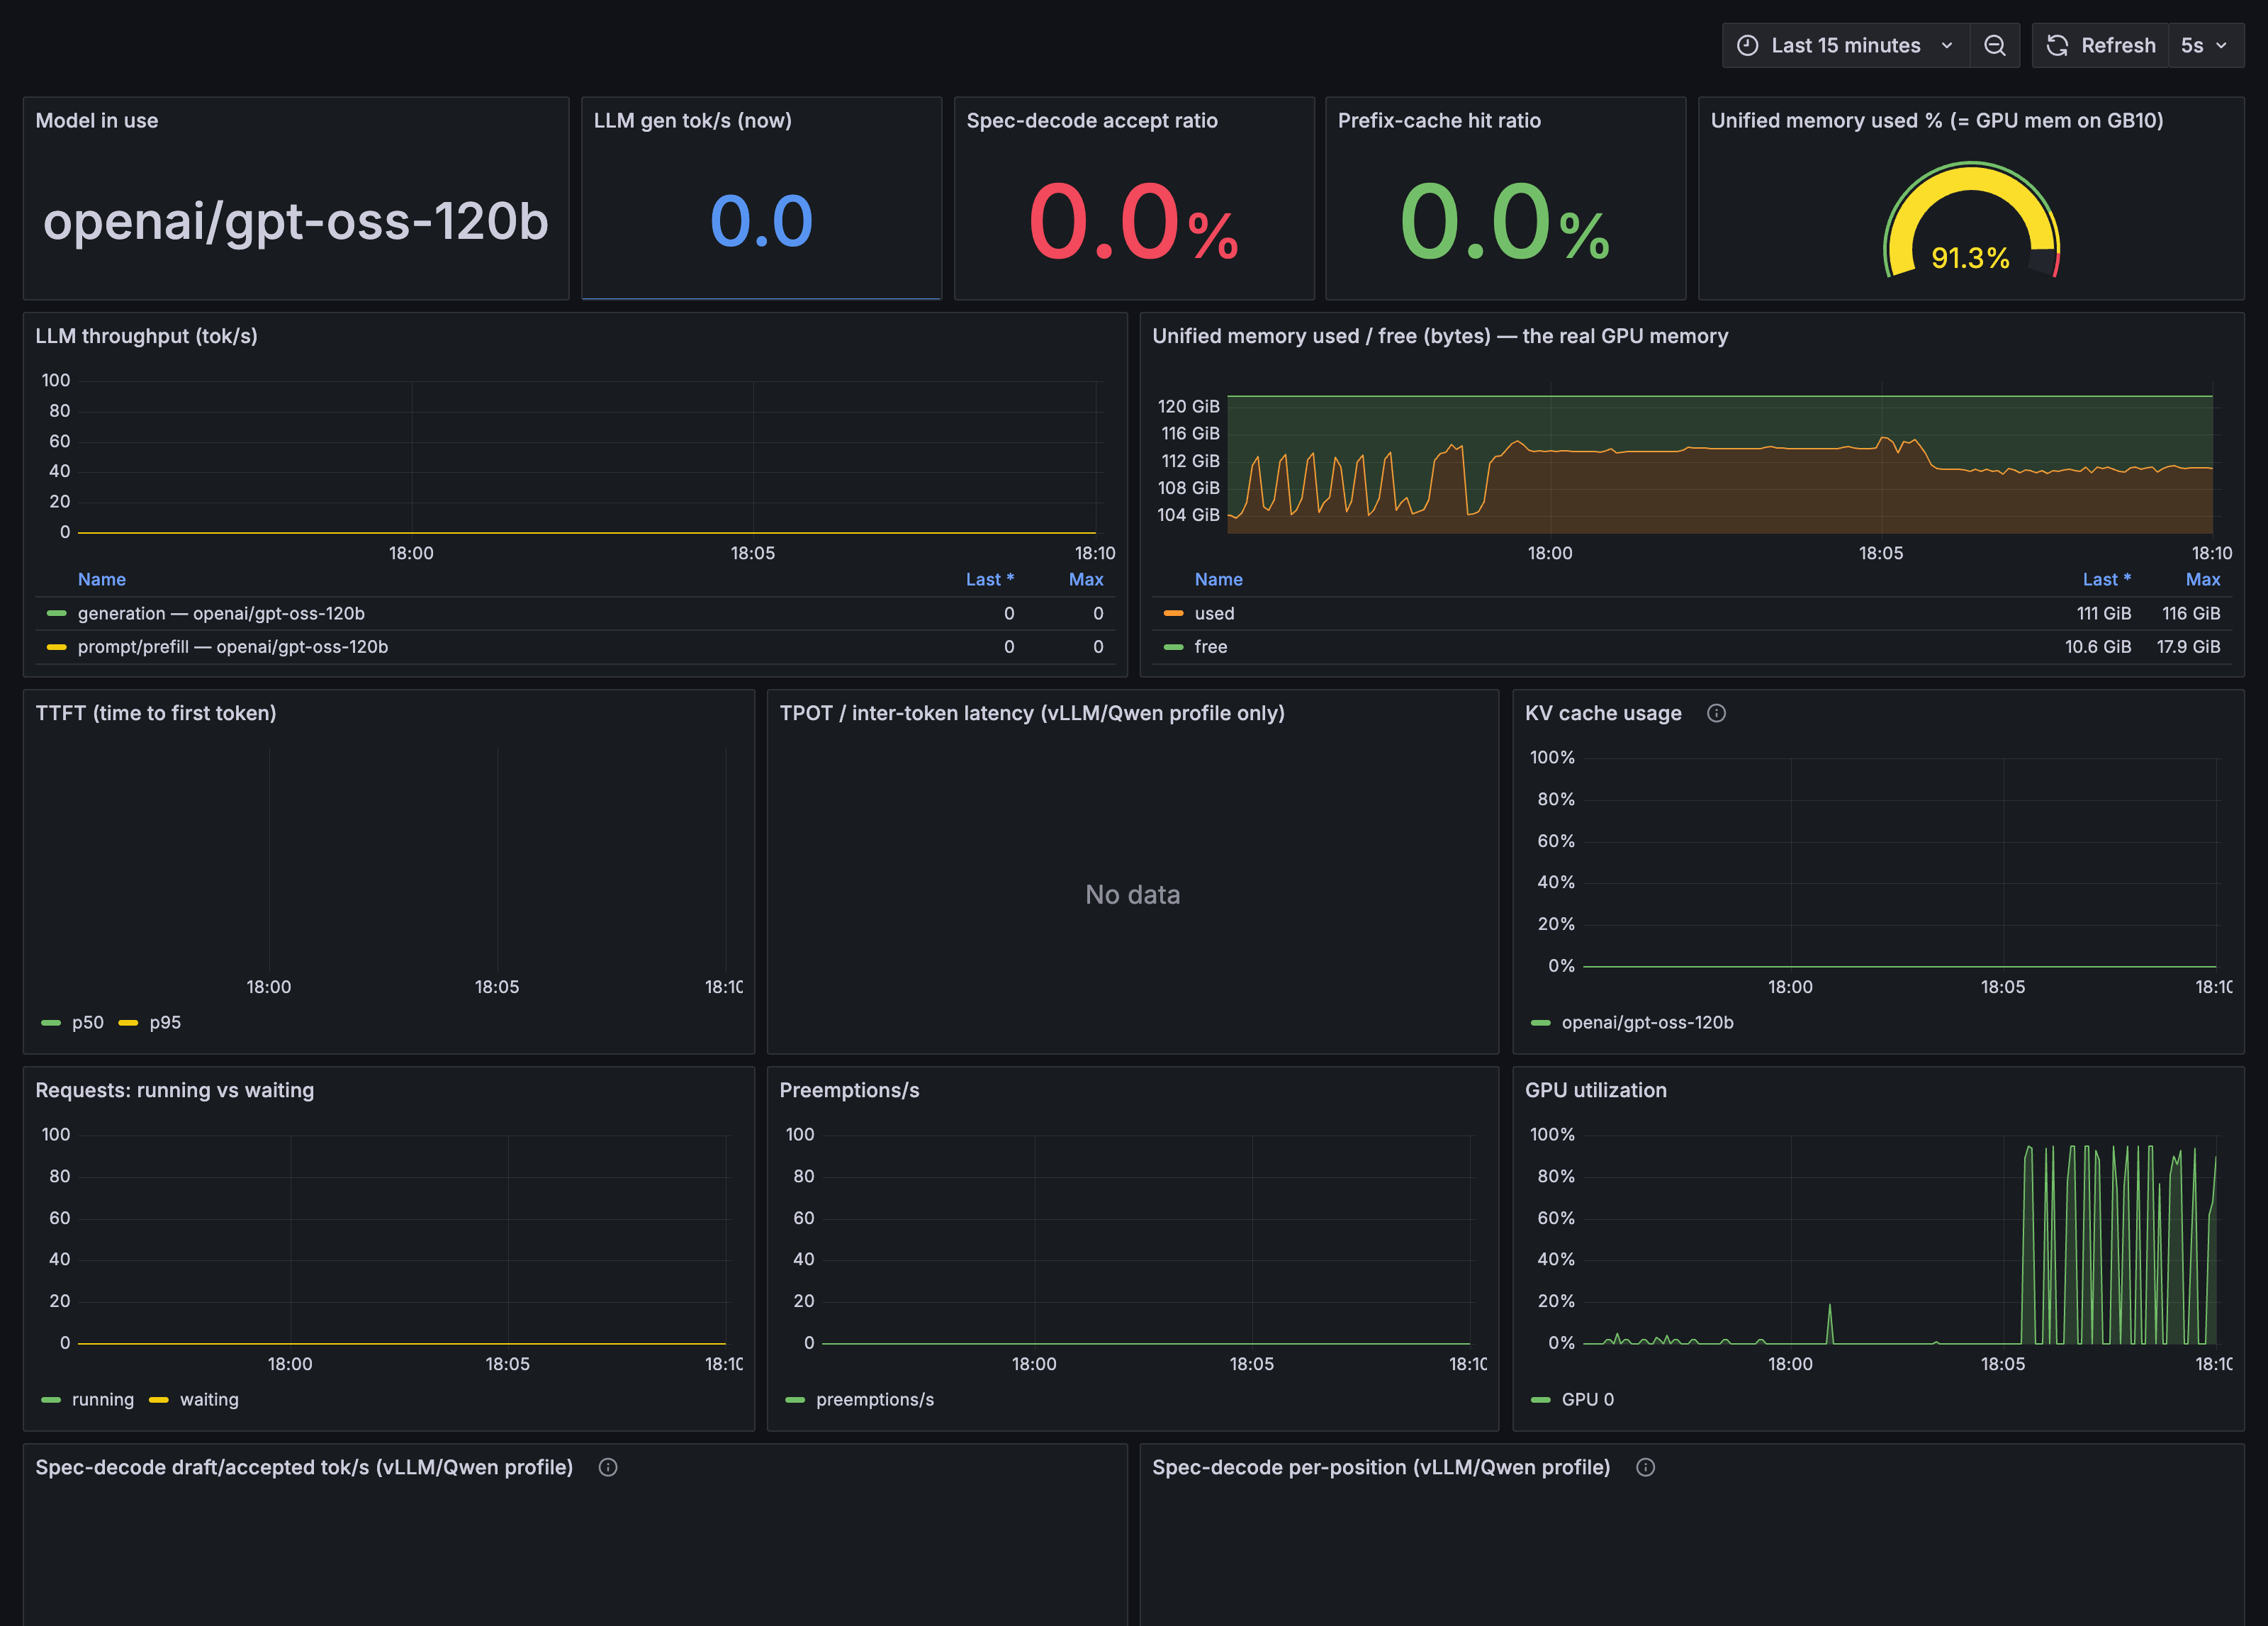
2. Extraction workers: 2 to 16 (a batch of 3 to a batch of 16)
Extraction crawled with the GPU idle. rag_worker was hardcoded at concurrency 2, so the engine saw two or three in-flight requests and never got to batch anything.
rag_worker concurrency |
Concurrent requests at the engine | Aggregate tok/s | Peak memory |
|---|---|---|---|
| 8 | ~8 | ~470 (3.9x) | 103 GiB |
| 16 | ~16 | ~650 (5.5x) | 106 GiB |
| 24 | ~24-27 | ~900 (7.5x) | 110 GiB |
| 32 | ~24-27 (plateau) | ~900 | 108 GiB |
16 is the stable optimum. 24 sits on the memory edge and 32 buys nothing more. Ingest concurrency is bound by memory, not the LLM engine: it scales to 128 sequences, but every concurrent document holds its chunks and embeddings in the same 121 GiB. Two smaller changes rode along: MAX_ASYNC to 8 took the merge summary wall from 59 s to ~15 s, and ocr_worker went from 2 to 6, since OCR had ~80% idle headroom.
Two settings that cost nothing
3. Turn thinking off (12x faster ingest, and a denser graph)
Leaving reasoning on for bulk graph extraction is the most expensive default in the stack. On the same 20-document HR corpus, thinking off finished in 28 minutes (0.71 docs/min); thinking on ran ~20 minutes per document, 12x slower, so I capped that run at two. It was worse too: fewer entities per document (~43 vs ~58), the budget spent on 3,000-token reasoning traces, often truncated and retried. Model choice to pair with this: Which LLM should you run on a DGX Spark?
4. The one-line OCR bug: max_workers 1 to 8 (166 to 110 s/doc)
OCR ran at 166 seconds a document, the GPU idle between pages. One line was responsible: pipeline.max_workers pinned to 1. That setting was right for the old single-stream OCR server, which held a threading.Lock around generate() so concurrency just queued and timed out. Against a batching vLLM vision server it starves the GPU: one page at a time to something that can absorb dozens (the same mismatch as when I moved from Ollama to vLLM).
| Config | Per-doc OCR | Peak batch | OCR docs/hr | GPU |
|---|---|---|---|---|
baseline (max_workers=1, ocr_worker=4) |
166 s | 4 | ~87 | idle |
max_workers=8, ocr_worker=4 |
61 s | 27 | ~143 | - |
max_workers=8, ocr_worker=8 |
110 s | 57 / 64 | 222 | 96% |
Environment variables only, no code change: the GPU went from idle to the bottleneck. Two caveats: the 2.5x is an OCR-phase number that only bought ~10% end to end (it mainly exposed the extraction and merge tail as the new gate), and the ceiling here is prefill, not decode, covered in Most people tuning local LLMs optimise the wrong half of the problem.
Fewer merge workers, more throughput
5. Graph-merge concurrency: 4 to 1 (217 lock timeouts to zero)
Our graph merge moved from a coarse per-knowledgebase lock to per-entity locks: more merge workers should have meant more parallelism. On a 100-document HR corpus, merge@4 produced 217 lock-timeout events and merged 9 of 100 documents in 40 minutes; merge@1 gave zero timeouts and kept pace with extraction.
More merge workers just meant more requests hitting the same hot entities. The per-entity lock spans read, LLM summary and write, and every document in that corpus contains "Base Salary" and "Superannuation Guarantee", so those entities get summarised one at a time, at single-stream speed. A waiter's acquire budget is 120 s: four successive 40-second holders blow it without any single hold exceeding it. Against a fast cloud LLM the same code ran merge@10 clean; forcing enable_thinking=False on summary calls took one hold from 189 s to ~4 s. The 217 is soft: it counts matching log lines, not distinct exceptions, from logs since rotated.
Two failures that looked like slow hardware
6. Clamp the context window
Every extraction call returned a 400. max_tokens defaulted to 65535 against gpt-oss's 65,536-token context, reserving the whole window for output and leaving nothing for input. A clamp exists, but that box's rag_service predated the gpt-oss switch and still carried DEFAULT_LLM_CONTEXT_WINDOW=262144, so the clamp saw 262K of room and let 65535 through. A related default, LLM_MEM_FRACTION=0.58, sized the KV pool at 2,667 tokens, below one 4,221-token extraction prompt, so every chunk was rejected; 0.64 gives a 209k pool.
max_tokens: 16384                 # was 65535, gpt-oss's entire context, no room for input
DEFAULT_LLM_CONTEXT_WINDOW=65536  # was 262144, left over from the Qwen config
LLM_MEM_FRACTION=0.64             # 0.58 sized the KV pool at 2,667 tokens, below one prompt
7. Reboot to clear a stuck GPU clock
The LLM was generating at ~18 tok/s while the GPU drew 10 W at 96% utilisation, a documented GB10 firmware bug rather than the swap contention I first suspected: the SM clock pins at 611 MHz against a 3,003 MHz maximum at performance state P0, and nvidia-smi -lgc 1500,3003 is accepted, then ignored. Only a reboot resets the governor. Afterwards: 2,548 MHz, 37 W, ~50 tok/s single-stream; every throughput number measured before was ~5x too slow and had to be re-run.
A five-minute systemd timer now watches for the SM clock sitting far below maximum at P0, paired with an ordered model load on boot: Docker honours depends_on on compose up but not on boot auto-restart, so the servers otherwise race the big LLM back into an OOM loop.
What to actually set
Two configurations survived. The production default is Qwen3.6-35B for extraction and serving, with a dedicated OCR model:
RAG_LLM_ENABLE_THINKING=false          # 12x faster ingest, denser graph
LLM_MAX_NUM_SEQS=32                    # match the engine batch to the worker fan-out
rag_worker         --concurrency=16    # 106 GiB peak; 24 = 110 GiB, on the edge
ocr_worker         --concurrency=8
graph_merge_worker --concurrency=1     # overlapping single-KB; 4 for diverse/multi-tenant
MAX_ASYNC=8
GLMOCR_PIPELINE_MAX_WORKERS=8          # any batching vision-OCR server wants this
The other is the consolidation build: one Gemma-4 26B-A4B doing chat, vision OCR and reranking, which frees the most memory.
GLMOCR_PIPELINE_MAX_WORKERS=8
OCR_WORKER_CONCURRENCY=8
RAG_WORKER_CONCURRENCY=6
MAX_ASYNC=8
--max-num-seqs 64
--gpu-memory-utilization 0.45          # vLLM: x TOTAL (unlike SGLang's x free-at-startup)
Then resist the urge to keep cranking. I spent a night pushing every knob to the ceiling: merge workers 8 to 16 brought the lock-timeout bursts back (28, against zero at 8), and raising the sequence cap 64 to 160 plus the memory fraction 0.45 to 0.55 thrashed OCR by ~3x (26 documents in 13 minutes, against 100 in 17.7 at baseline) and pushed the box to 113 GiB. The GPU was already prefill-saturated at 64.
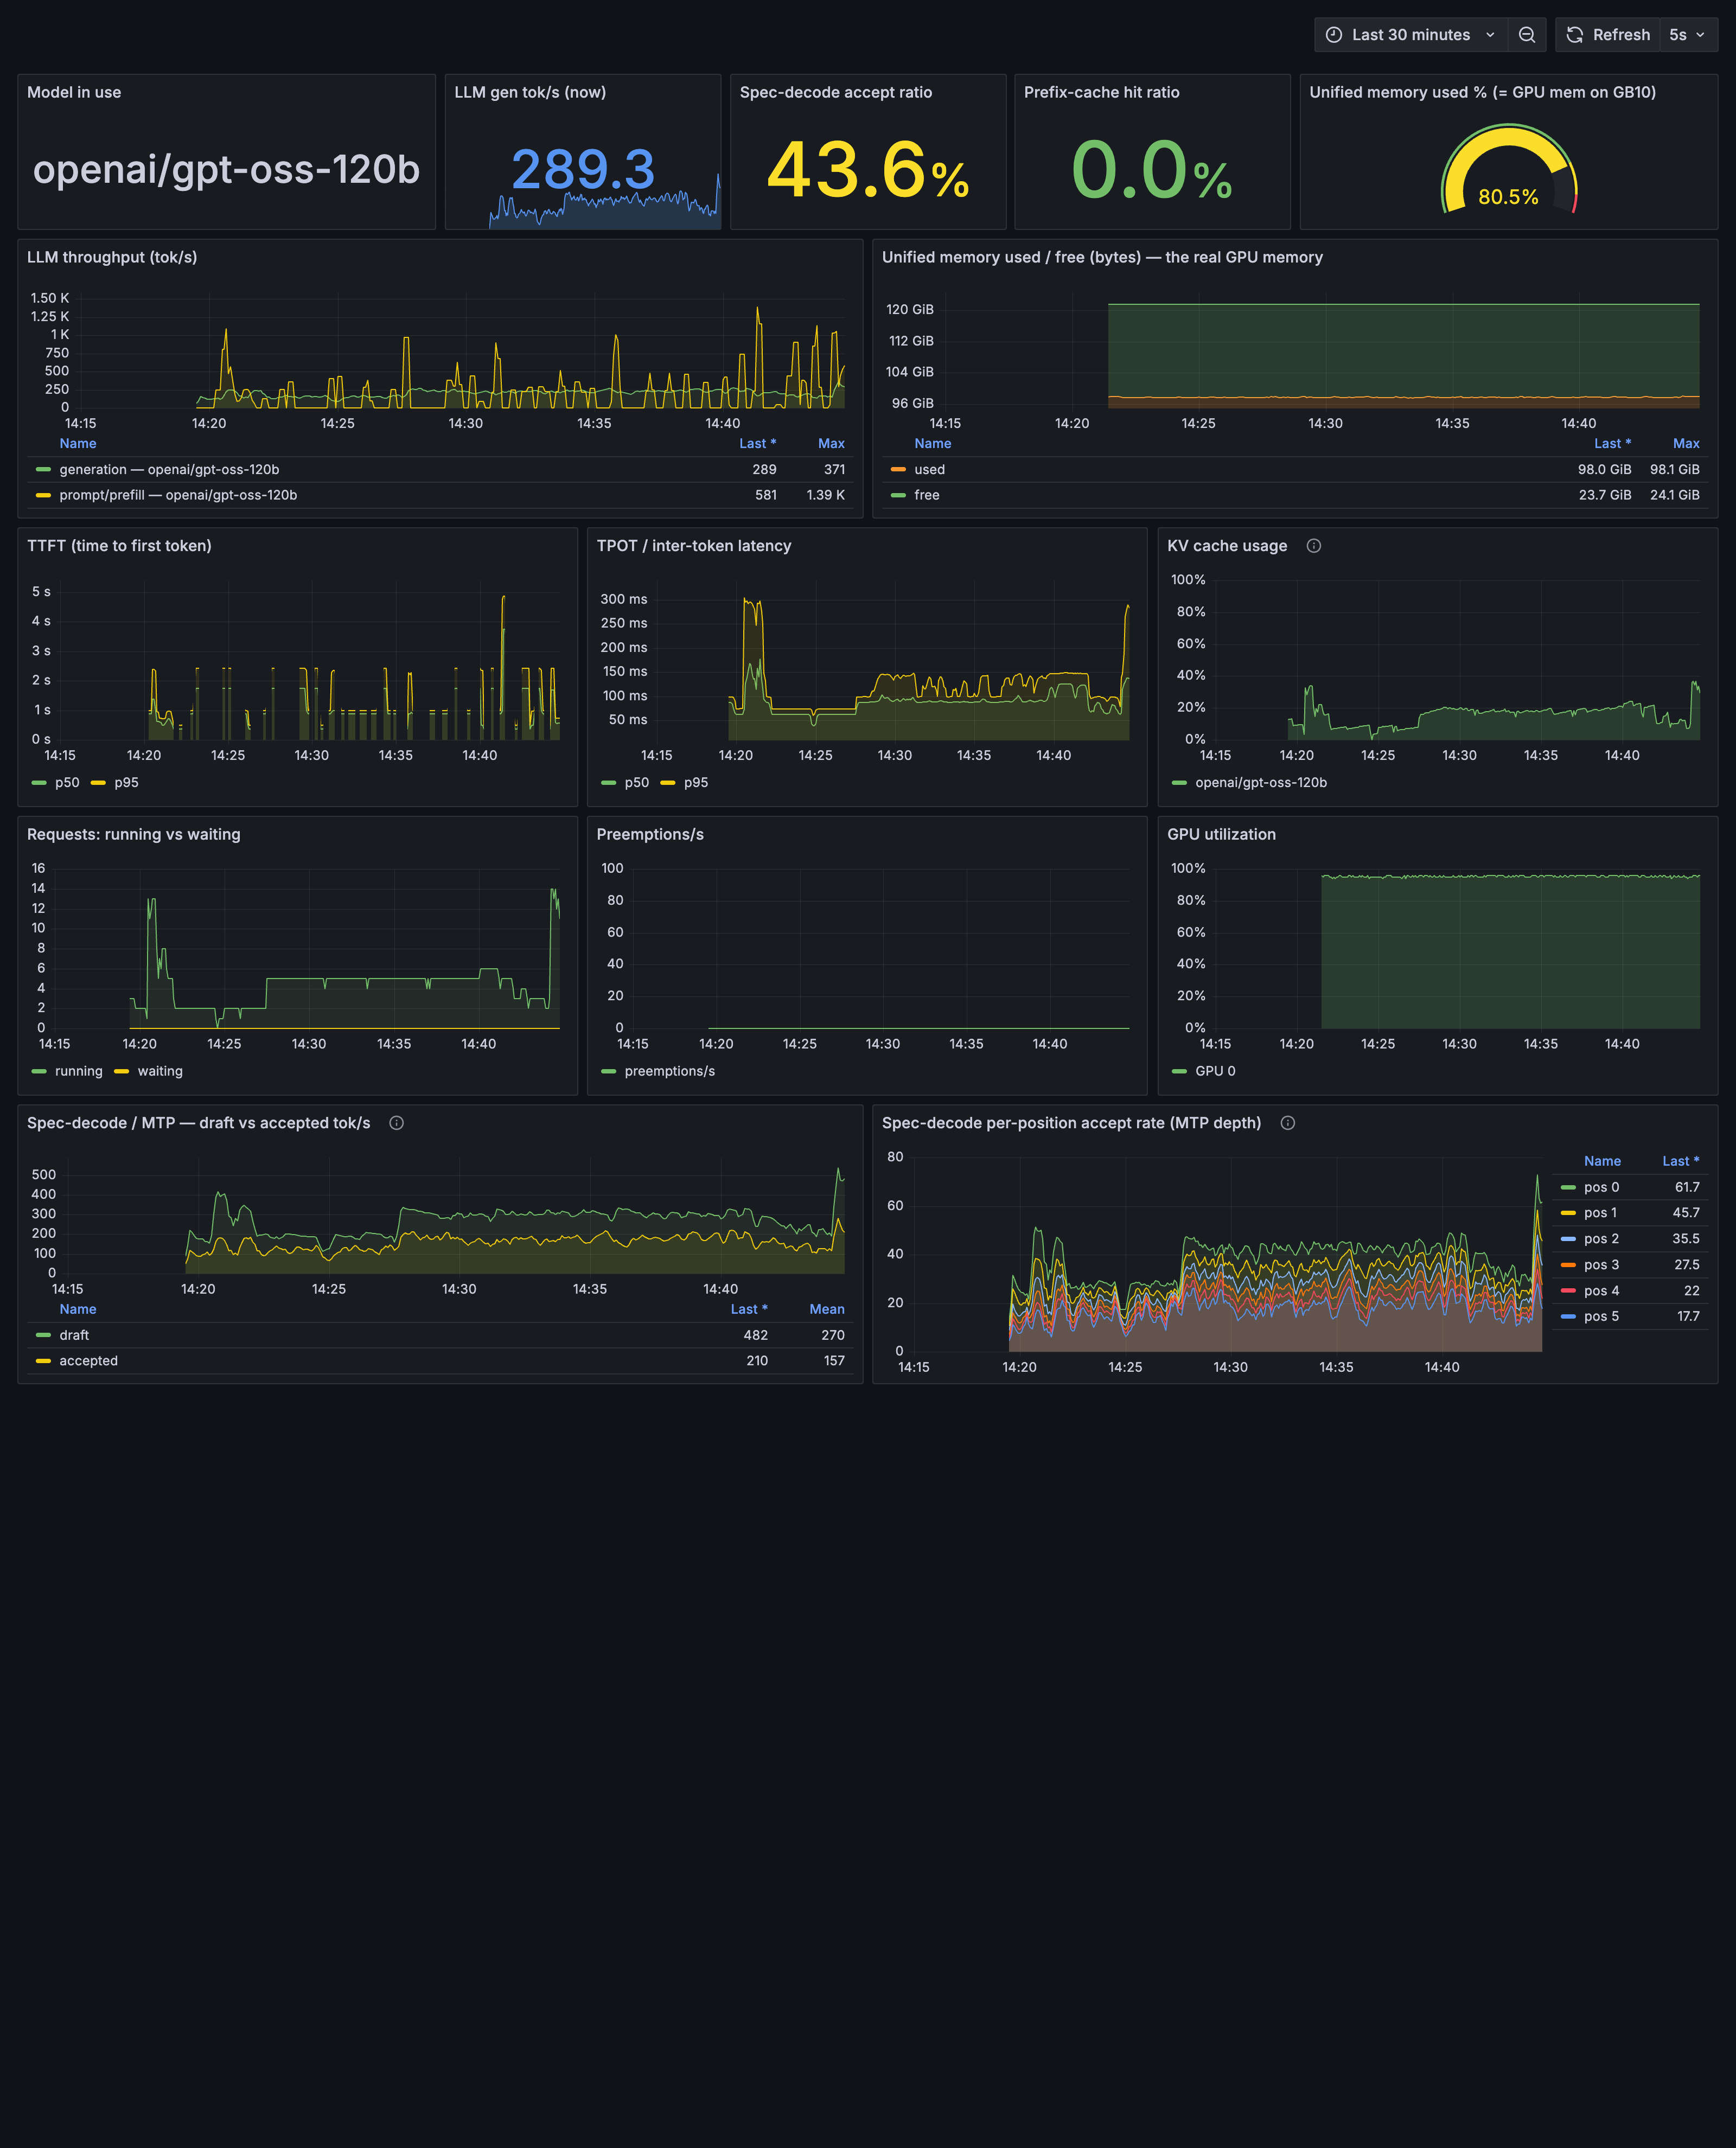
How this was measured: one DGX Spark, instrumented with Prometheus, node-exporter and the DCGM GPU exporter feeding Grafana, plus worker counters from the pipeline. Every figure here is speed, memory or an operational number, not quality, tested separately on a fixed 49-question set in the model comparison. Documents-per-hour figures aren't comparable across stacks, since the corpora differ. Where a number is soft, like the 217, I've flagged it inline.
Six settings and one reboot
Six of these were a configuration value; the seventh was a reboot. Each one meant spotting which constraint was actually binding, and getting it wrong tunes hard in the wrong direction, as the max-crank night cost me.
This matters at Certant because this class of box is what customers point at when documents can't leave the building. A whole knowledge-graph pipeline (OCR, embedding, extraction, merge, chat, citations) has to fit in one 121 GiB pool, air-gapped, and stay up without someone SSHing in each morning.