\"128GB of VRAM\" is the most misread spec on the DGX Spark
The DGX Spark's 128GB is one pool shared by CPU and GPU, not VRAM: the memory budget, the OOM spike, and what to set.
Treat 128GB like VRAM and the box won't boot. The GB10 Grace Blackwell chip in the DGX Spark, and the ASUS GX10 (same silicon), shares one pool of LPDDR5X between CPU and GPU: no discrete card, system RAM and GPU memory are the same number. Marketed as 128 GB, usable is about 121 GiB, split between the model, its KV cache, the embedding and reranker models, OCR and everything else.
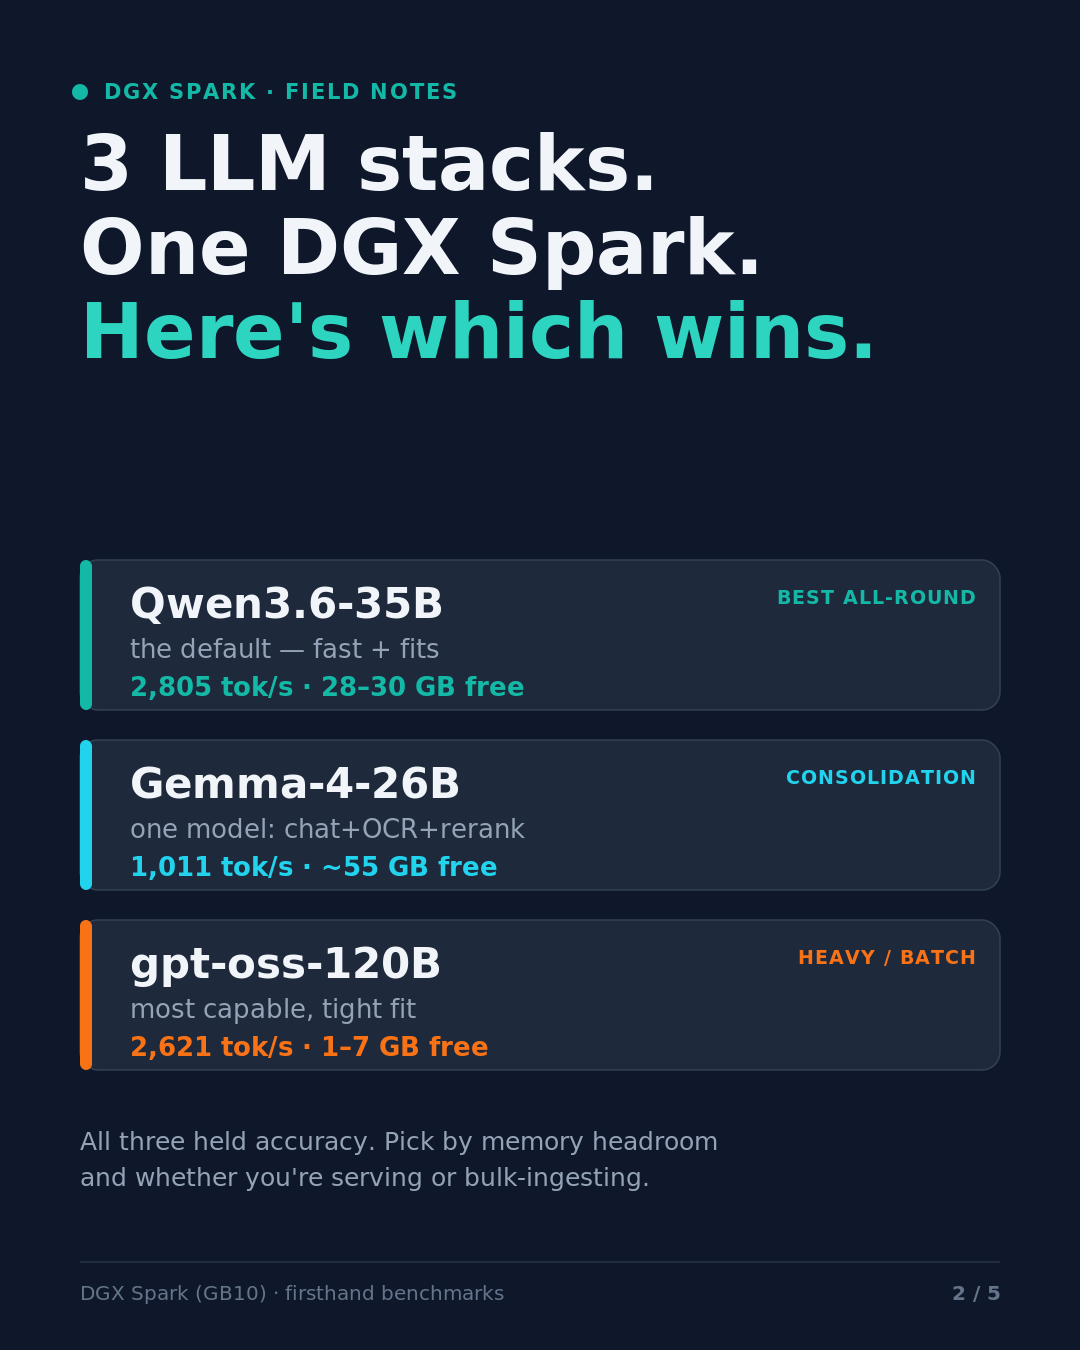
I spent a month running three model stacks on one of these: gpt-oss-120B, Qwen3.6-35B-A3B and Gemma-4 26B-A4B. Speed gets the attention, but memory decided the shipping config: tune around speed, run out of memory and the kernel kills a process. Single-stream speed is the wrong test, covered in Your DGX Spark isn't slow. You're testing it wrong..
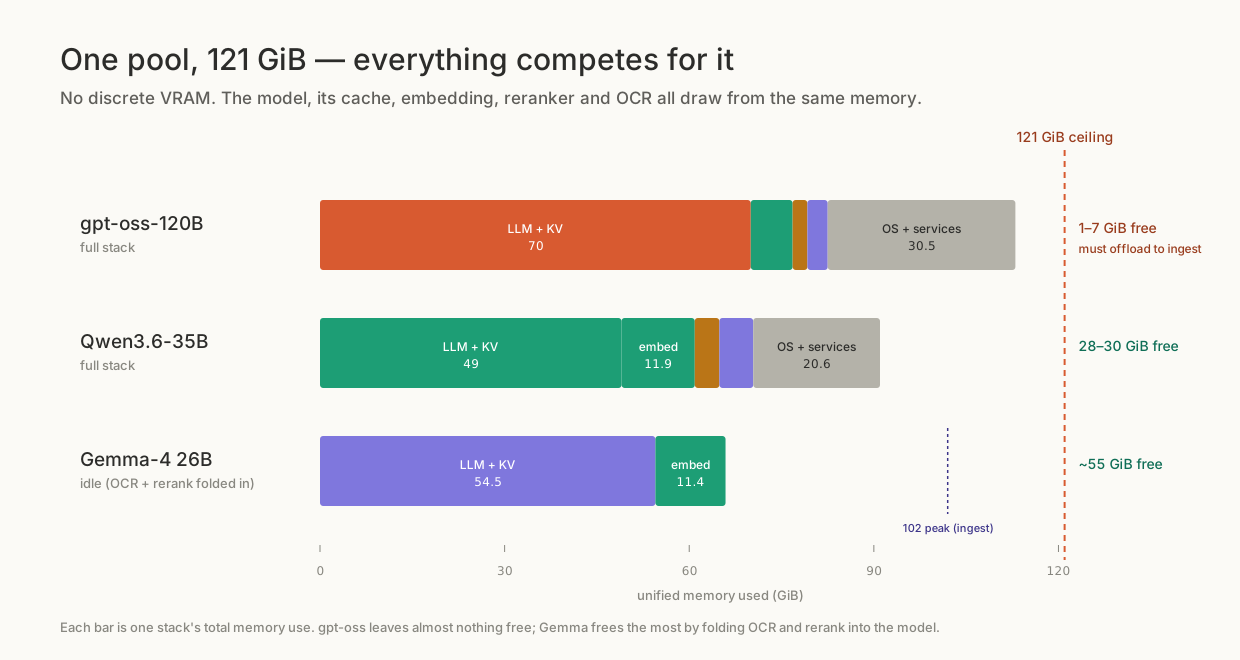
One pool, 121 GiB: gpt-oss-120B's full stack leaves 1 to 7 GiB free, Qwen3.6 leaves 28 to 30 GiB, Gemma-4 about 55 GiB at idle.
One pool, one budget
A normal GPU box keeps two independent budgets: model in VRAM, services in system RAM, interfering only at load time. The GB10 has one budget for everything: admin UI, Celery workers, Postgres buffers, page cache and KV cache, all drawn from the same 121 GiB.
The component budget
Same box, same pipeline (OCR, embed, extract, merge): the model at each stage changes.
| Component | gpt-oss-120B | Qwen3.6-35B | Gemma-4 26B |
|---|---|---|---|
| LLM weights + KV cache | 67 to 74 GiB | 49 GiB | 54.5 GiB |
| Embedding model (Qwen3-Embedding-4B) | 6.8 GiB | 11.9 GiB | 11.4 GiB |
| Reranker | 2.4 GiB | 4 GiB | ~0, folded into the LLM |
| OCR | 3.3 GiB (GLM-OCR) | 5 to 6 GiB (GLM-OCR) | ~0, folded into the LLM |
| Total used | 111 to 114 GiB | ~91 GiB | ~66 GiB idle / 102 peak ingest |
| Free | 1 to 7 GiB | 28 to 30 GiB | ~55 GiB idle |
Those totals exclude the host: OS, kernel and Docker daemon take roughly 5 GB before a model loads, and application containers add more.
gpt-oss-120B is the worst case: full stack up, it leaves 1 to 7 GiB free and OOMs. To ingest documents we shut down 15 to 20 GiB of non-essential services, and still more than two concurrent jobs put us back on the edge. Qwen3.6's 28 to 30 GiB of slack is why it runs at real concurrency, and why the model choice on this box is a memory decision.
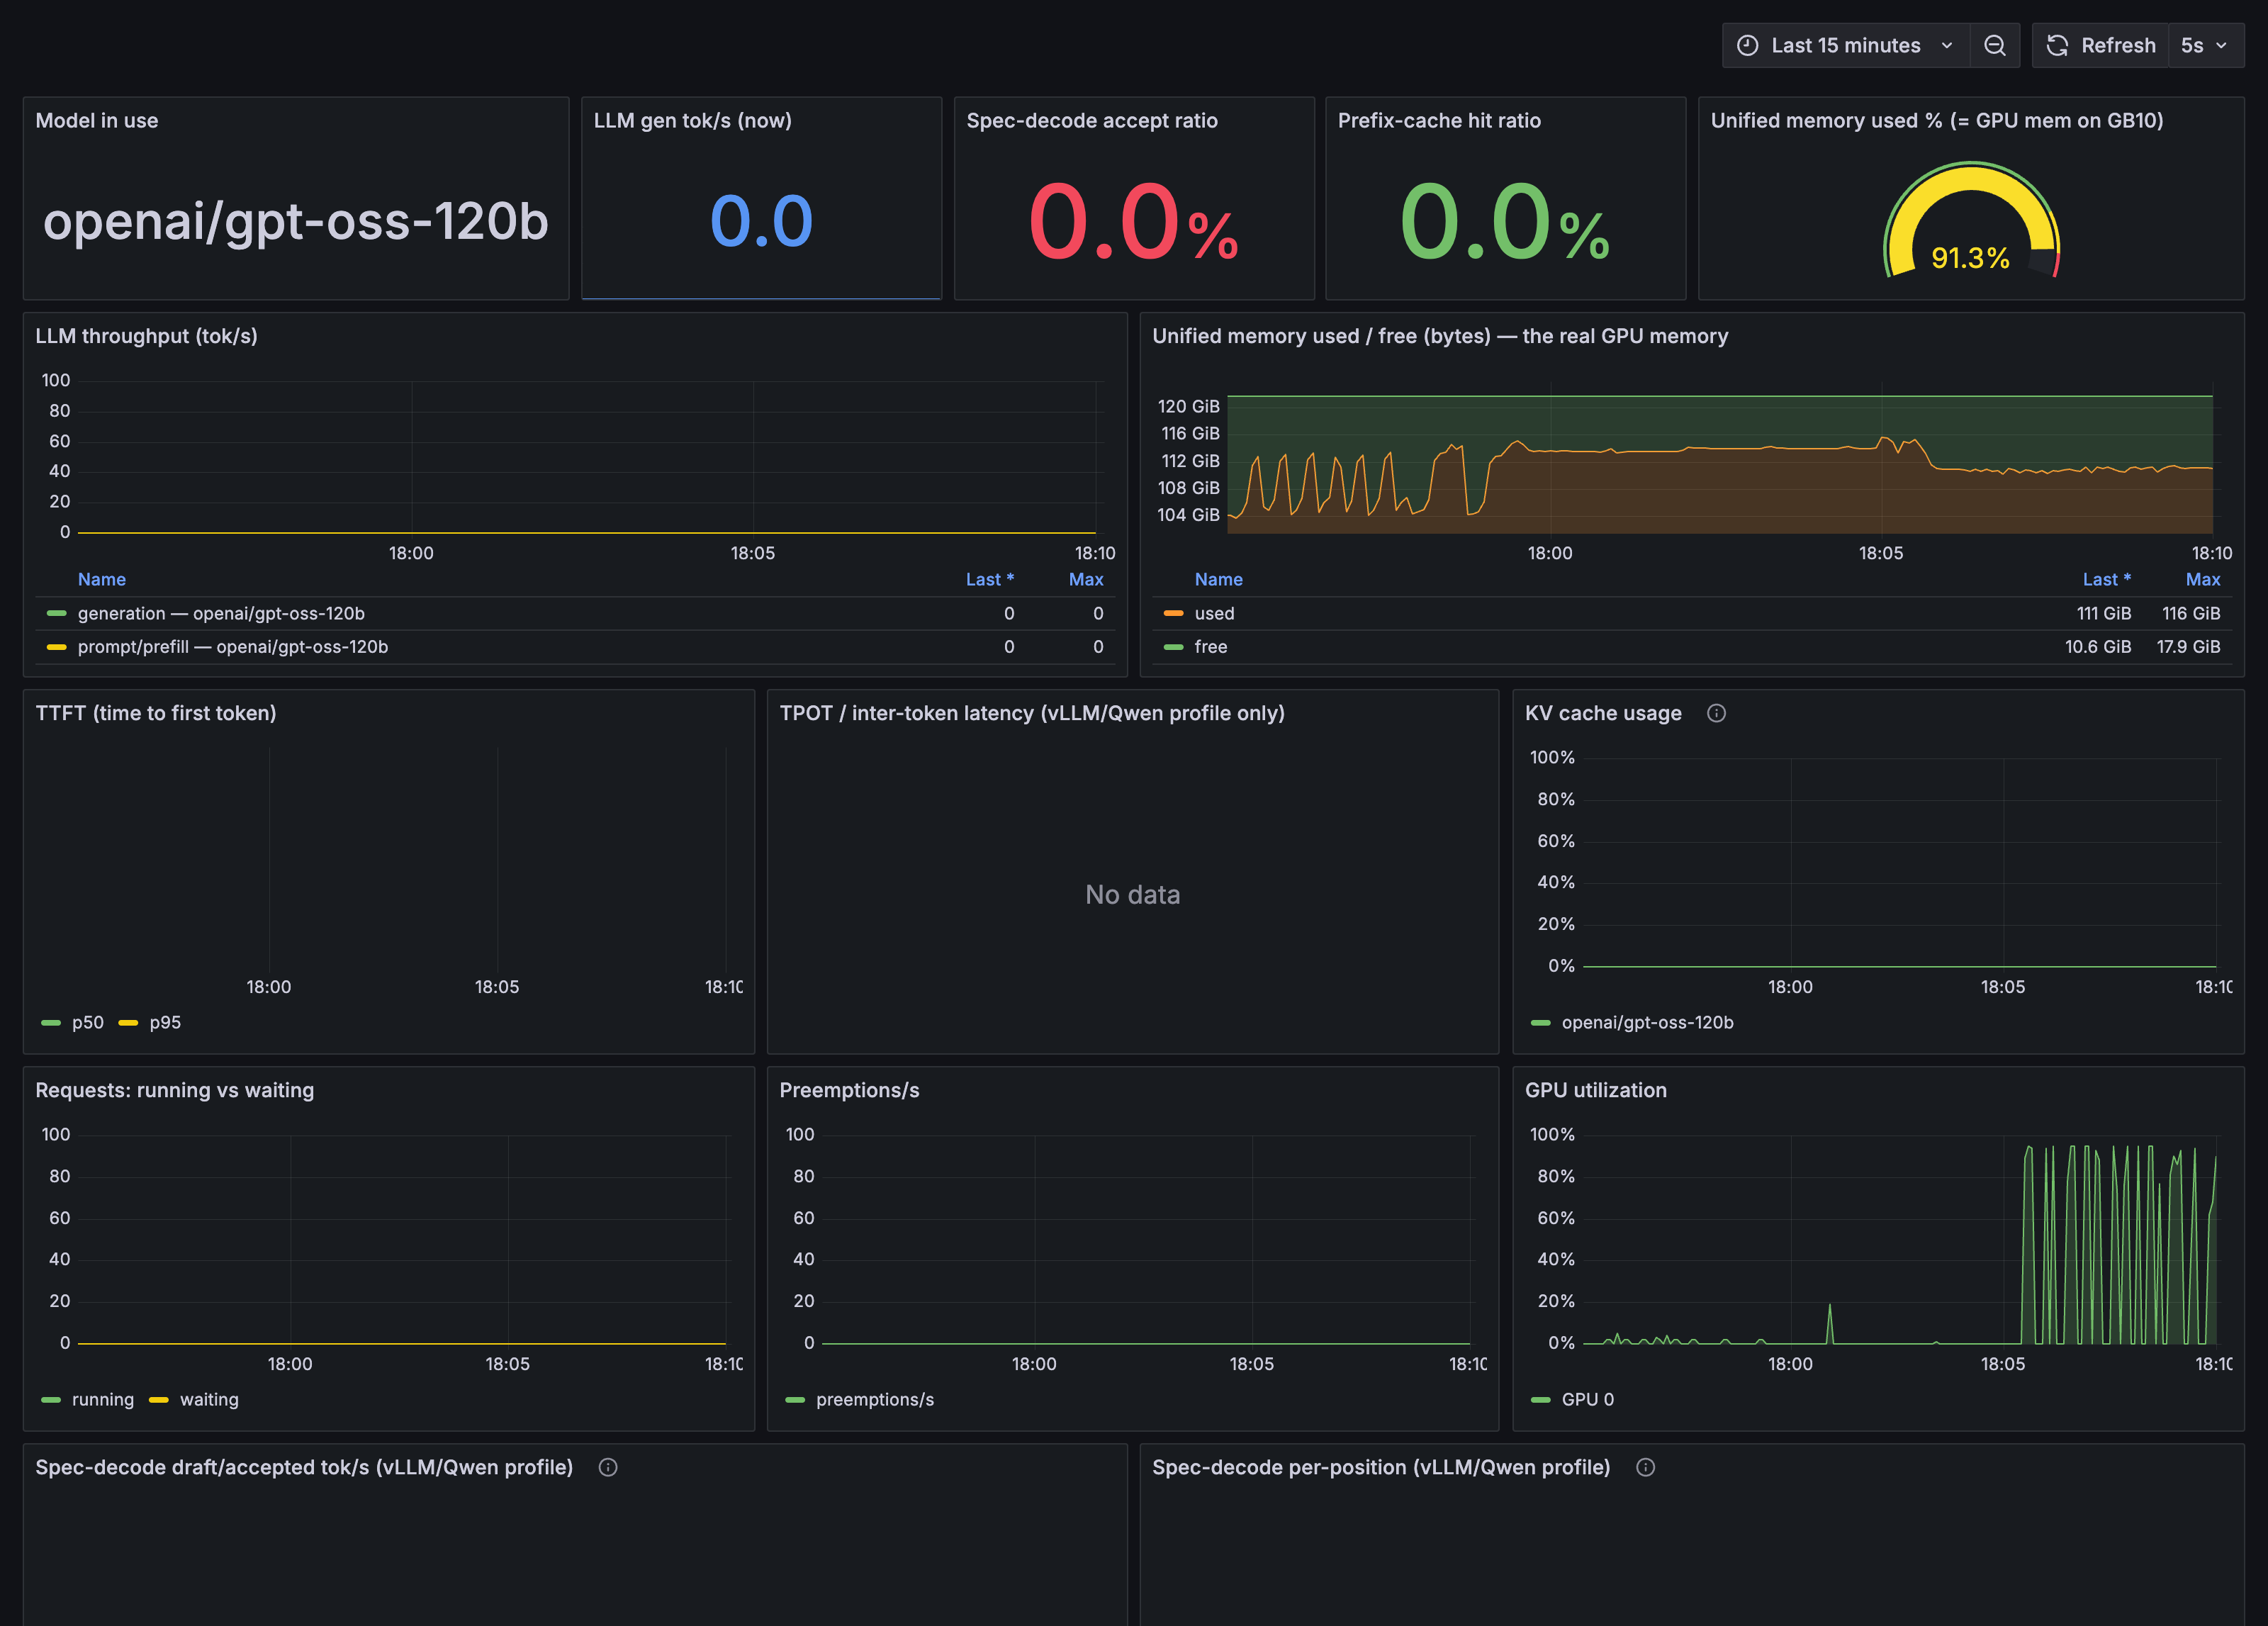
The gpt-oss stack at steady state: 111 GiB used, 10.6 GiB free (91% of the pool), peaking at 116 GiB. That sliver is the safety margin.
The spike happens at load time
I got this wrong, loudly: I'd told people gpt-oss-120B "uses about 70 GB", true at steady state but not during the load.
The 61 GB of MXFP4 weights briefly exist twice: once device-resident, once host-staged during the copy. Add the page cache still held for the unread mmap'd safetensors, and the transient sails past the ceiling. The OOM event below ran six minutes end to end:
| Time | Used | Available | What's happening |
|---|---|---|---|
| 12:30:20 | 8.9 GiB | 112 GiB | App stack up, LLM container created |
| 12:30:36 | 75 GiB | 46 GiB | 15/15 shards mapped in under a second |
| 12:31:53 | 85 GiB | 36 GiB | SGLang allocating CUDA buffers and the KV pool |
| 12:35:14 | 111 GiB | 10 GiB | Page cache from the mmap'd weights bloating |
| 12:36:00 | 120 GiB | 1.5 GiB | OOM-killer fires |
| 12:36:15 | 69 GiB | 52 GiB | Scheduler SIGKILL'd, memory released |
anon-rss runs about 55 GB for the SGLang scheduler while the system reports 120 GiB used; the 65 GB delta is page cache the kernel can't reclaim because SGLang hasn't finished with them. My estimate was off by 40 to 50 GB. The only symptom was Exited (137) on repeat, with nothing useful in the container log.
The fix is to give the spike somewhere to spill. The box ships with about 16 GB of swap on eMMC, nowhere near enough for a 55 GB staging copy, so we provisioned a 64 GB swapfile (79 GB total) and set vm.swappiness=100. The weights now take 420 seconds to materialise: slower, but clean every time. Our installer auto-provisions at least 48 GiB before the model layer comes up.
SGLang and vLLM count memory fractions differently
The second problem was a semantics trap: SGLang's --mem-fraction-static is a fraction of the memory free when that server starts; vLLM's --gpu-memory-utilization is a fraction of total memory.
The servers load serially, so each starts with a smaller free pool than the last and later models need larger fractions. Dropping the LLM to 0.50 meant 0.50 × ~112 GiB free ≈ 60.5 GB, just under the 61 GB of weights, and the KV-pool configurator aborted: "Not enough memory. Please try to increase --mem-fraction-static." The embedding server starts with only ~43 GiB free, so 0.10 × 43 ≈ 4.3 GB against 8.2 GB of weights: same abort, because that 10% was measured against whatever was free, not the full 121 GiB pool.
What to set
What got the heavy stack booting and staying up:
# /opt/mindlattice/.env (SGLang servers load serially, so later
# fractions must be LARGER: each sees less free memory than the last)
LLM_MEM_FRACTION=0.55      # gpt-oss-120b, 0.55 x ~112 GiB free at boot
EMBED_MEM_FRACTION=0.30    # starts with ~43 GiB free
RERANK_MEM_FRACTION=0.15

# Give the load-phase double-buffer somewhere to spill.
sudo fallocate -l 64G /swapfile
sudo mkswap /swapfile && sudo swapon /swapfile
sudo sysctl -w vm.swappiness=100   # persist in /etc/sysctl.d
On a dedicated batch box with non-essentials offloaded we recommend LLM_MEM_FRACTION=0.64. The fraction also sizes the KV pool: at 0.58, extraction calls came back 400 rather than crashing. Load the models in a fixed order at boot, LLM first, so they don't race into the ceiling.
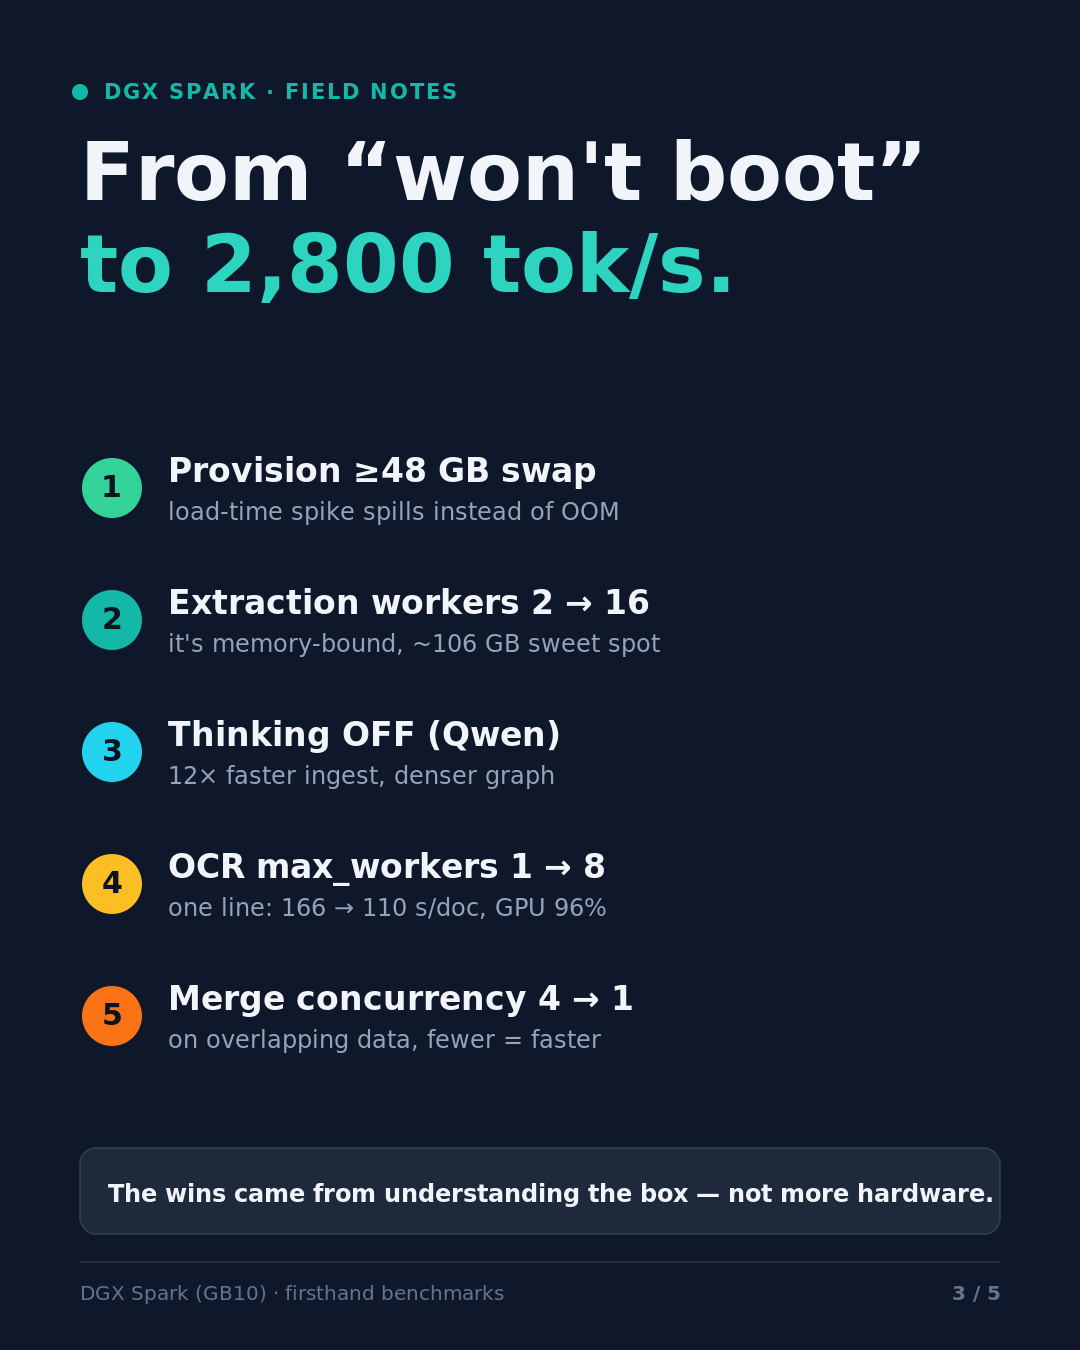
Worker concurrency is the other lever people miss. Extraction is memory-bound, not compute-bound: each document's chunks and embeddings share the same pool. Raising RAG workers from 2 to 16 was the sweet spot at about 106 GiB used; 24 hit 110 GiB, and 32 plateaued. The box has 22 to 43 times more batching headroom than large-document ingest can use. Six other levers are in Seven levers that took a DGX Spark from "won't boot" to 2,800 tokens a second.
Three implications if you're speccing one of these
Model choice is a memory decision
Tokens per second gets compared. What the model leaves behind matters more: whether your embedding model, OCR, reranker and application fit on the same machine, or you need a second box.
Consolidation pays
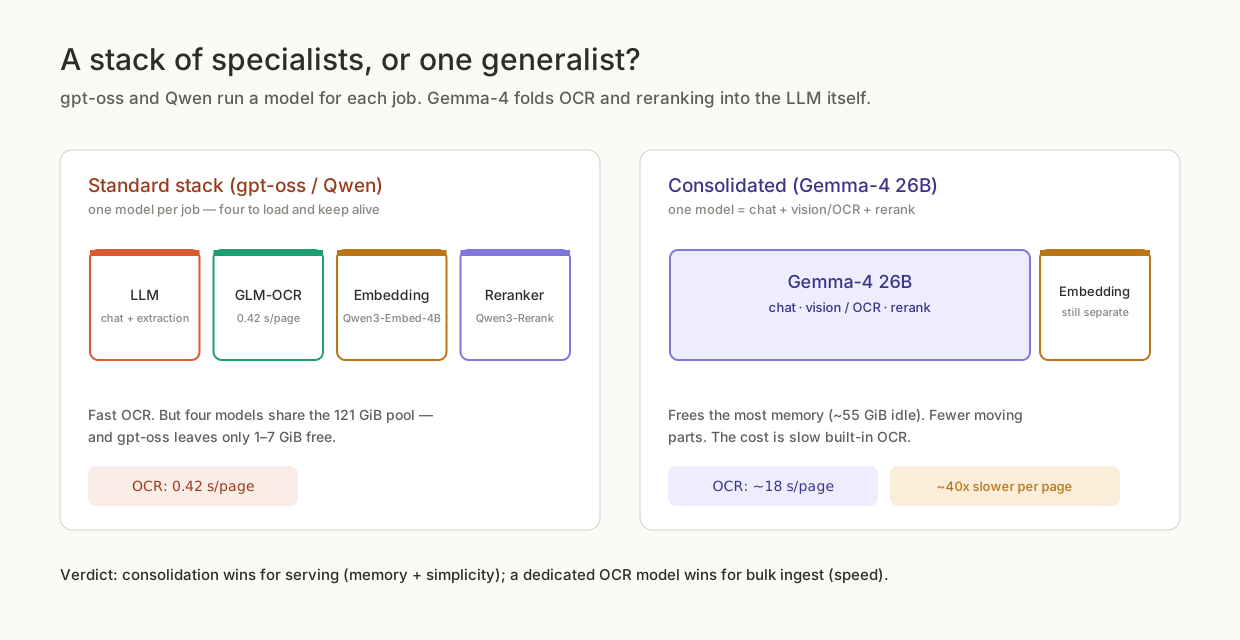
Four separate models against one consolidated model: folding OCR and reranking into the LLM frees the most memory (~55 GiB idle), at ~18 s/page against a dedicated model's 0.42 s/page.
Gemma-4 26B does chat, vision/OCR and reranking on one set of weights. Two rows of that table go to roughly zero, and the stack idles at ~66 GiB instead of 111 to 114. The cost is OCR throughput: about 18 seconds a page against GLM-OCR's 0.42, roughly 40 times slower. Consolidation wins for serving; a dedicated OCR model wins for bulk ingest.
Watch the load spike
Every capacity plan I've seen for this hardware budgets the resting footprint. Size for the transient and give it swap. Take the peak reading from a cold start.
How this was measured
Everything above comes from one physical DGX Spark running the product stack: Prometheus, node-exporter and the DCGM GPU exporter into Grafana, plus free -h, docker stats and kernel OOM logs. This piece covers speed, memory and operations; the three stacks were scored on a 49-question test set, in the model-comparison article. Documents-per-hour isn't comparable across stacks: corpora and worker caps differ. The load timeline is one measured event, but it reproduced on every cold start.
A DGX Spark is the machine we deploy Certant onto when a customer's data can't leave the building: one box holds the model, the embeddings, the OCR, the graph and the application, and whether it runs offline, or doesn't start at all, comes down to the memory budget. Ingest is gated by a different resource, covered in Most people tuning local LLMs optimise the wrong half of the problem.