The standard stack: gpt-oss-120B and a full RAG pipeline on one box
Four models in 121 GiB of unified memory, 1 to 7 GiB free, and the boot loop that took a 64 GB swapfile to fix. The DGX Spark reference build, warts included.
This is the most capable configuration we ran on a DGX Spark, and the one that almost didn't fit: four models resident at once, our whole document pipeline on top, a steady-state reading of 111 to 114 GiB used out of roughly 121 GiB, and 1 to 7 GiB of headroom for everything else the machine has to do.
The last clean end-to-end run was on 31 May 2026. Two days later it was OOM-killing itself on every start.
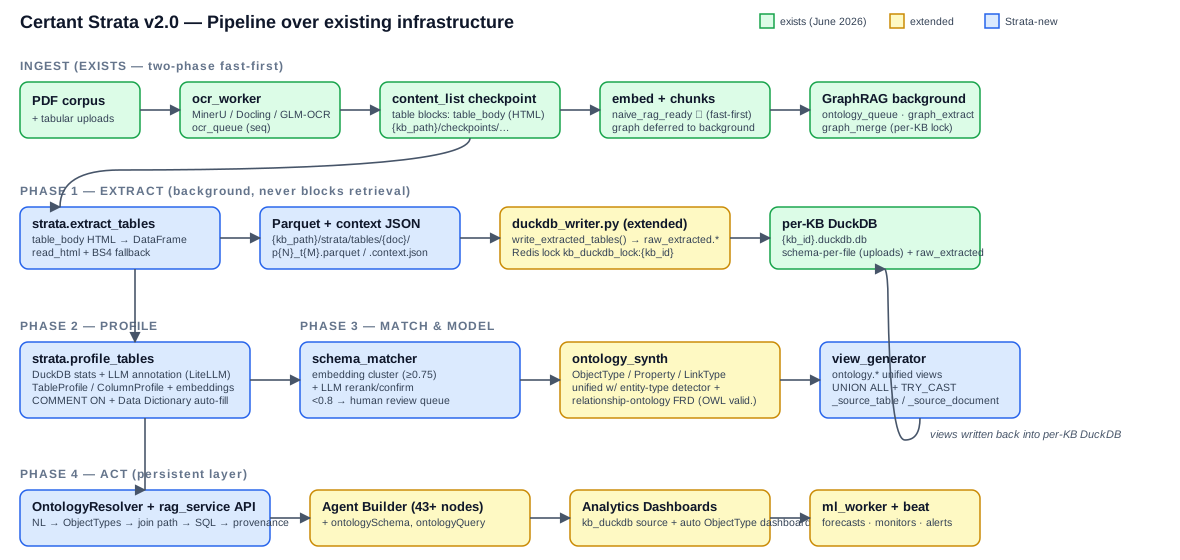
This is the reference build for when a customer says the documents can't leave the building: gpt-oss-120B handles chat and graph extraction, GLM-OCR reads pages, Qwen3-Embedding-4B does vectors, Qwen3-Reranker-0.6B handles search ordering, all four drawing on the same memory pool.
One model per job
The GB10 has one memory pool shared by CPU and GPU; every model loaded comes out of it. Figures below are from the SGLang startup logs, not docker stats: container RSS misleads on unified memory, since the GPU pool isn't cgroup-visible.
| Service | Model | Pool (tokens) | Reserved |
|---|---|---|---|
| LLM | gpt-oss-120b, native MXFP4, SGLang | 209,055 | ~73.6 GiB (66.86 weights + ~3.4 KV + ~3 graph) |
| Embedding | Qwen3-Embedding-4B, fp8 | 8,192 | ~6.8 GiB |
| Reranker | Qwen3-Reranker-0.6B, fp8 | 3,150 | ~2.4 GiB |
| OCR | GLM-OCR on SGLang, triton, cuda-graph off | 16,105 | ~3.3 GiB |
Those figures are from the gpt-oss concurrency benchmark, measured with 18 containers up. The models are weights-dominated, so trimming a KV pool barely moves the needle, and the embedding server ignores its memory fraction, having no KV cache to size.
The memory squeeze
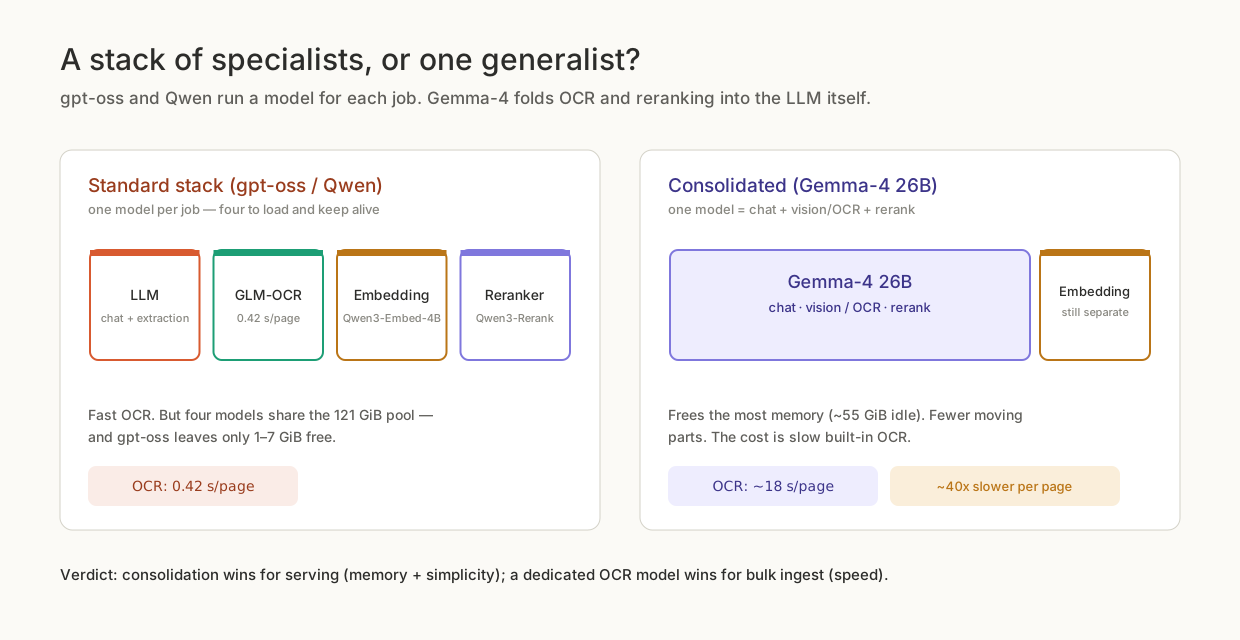
The component-by-component ledger for all three stacks we tested:
| Component | gpt-oss-120B | Qwen3.6-35B | Gemma-4 26B |
|---|---|---|---|
| LLM weights + KV | 67-74 GiB | 49 GiB | 54.5 GiB |
| Embedding | 6.8 GiB | 11.9 GiB | 11.4 GiB |
| Reranker | 2.4 GiB | 4 GiB | ~0 (folded into the LLM) |
| OCR | 3.3 GiB (GLM-OCR) | 5-6 GiB (GLM-OCR) | ~0 (Gemma vision) |
| Total used | 111-114 GiB | ~91 GiB | ~66 GiB idle, 102 peak |
| Free | 1-7 GiB | 28-30 GiB | ~55 GiB idle |
At 1 to 7 GiB free, we shut off around 15 to 20 GiB of non-essential services to get the box ingesting at all: admin UI, chatbox, reranker, flower, ml_worker. More than two concurrent ingest jobs risks an OOM kill. Idle with everything up: used=115 GiB, avail=5-6 GiB, swap at 6 GiB, climbing to 12 GiB under a 20-document burst.
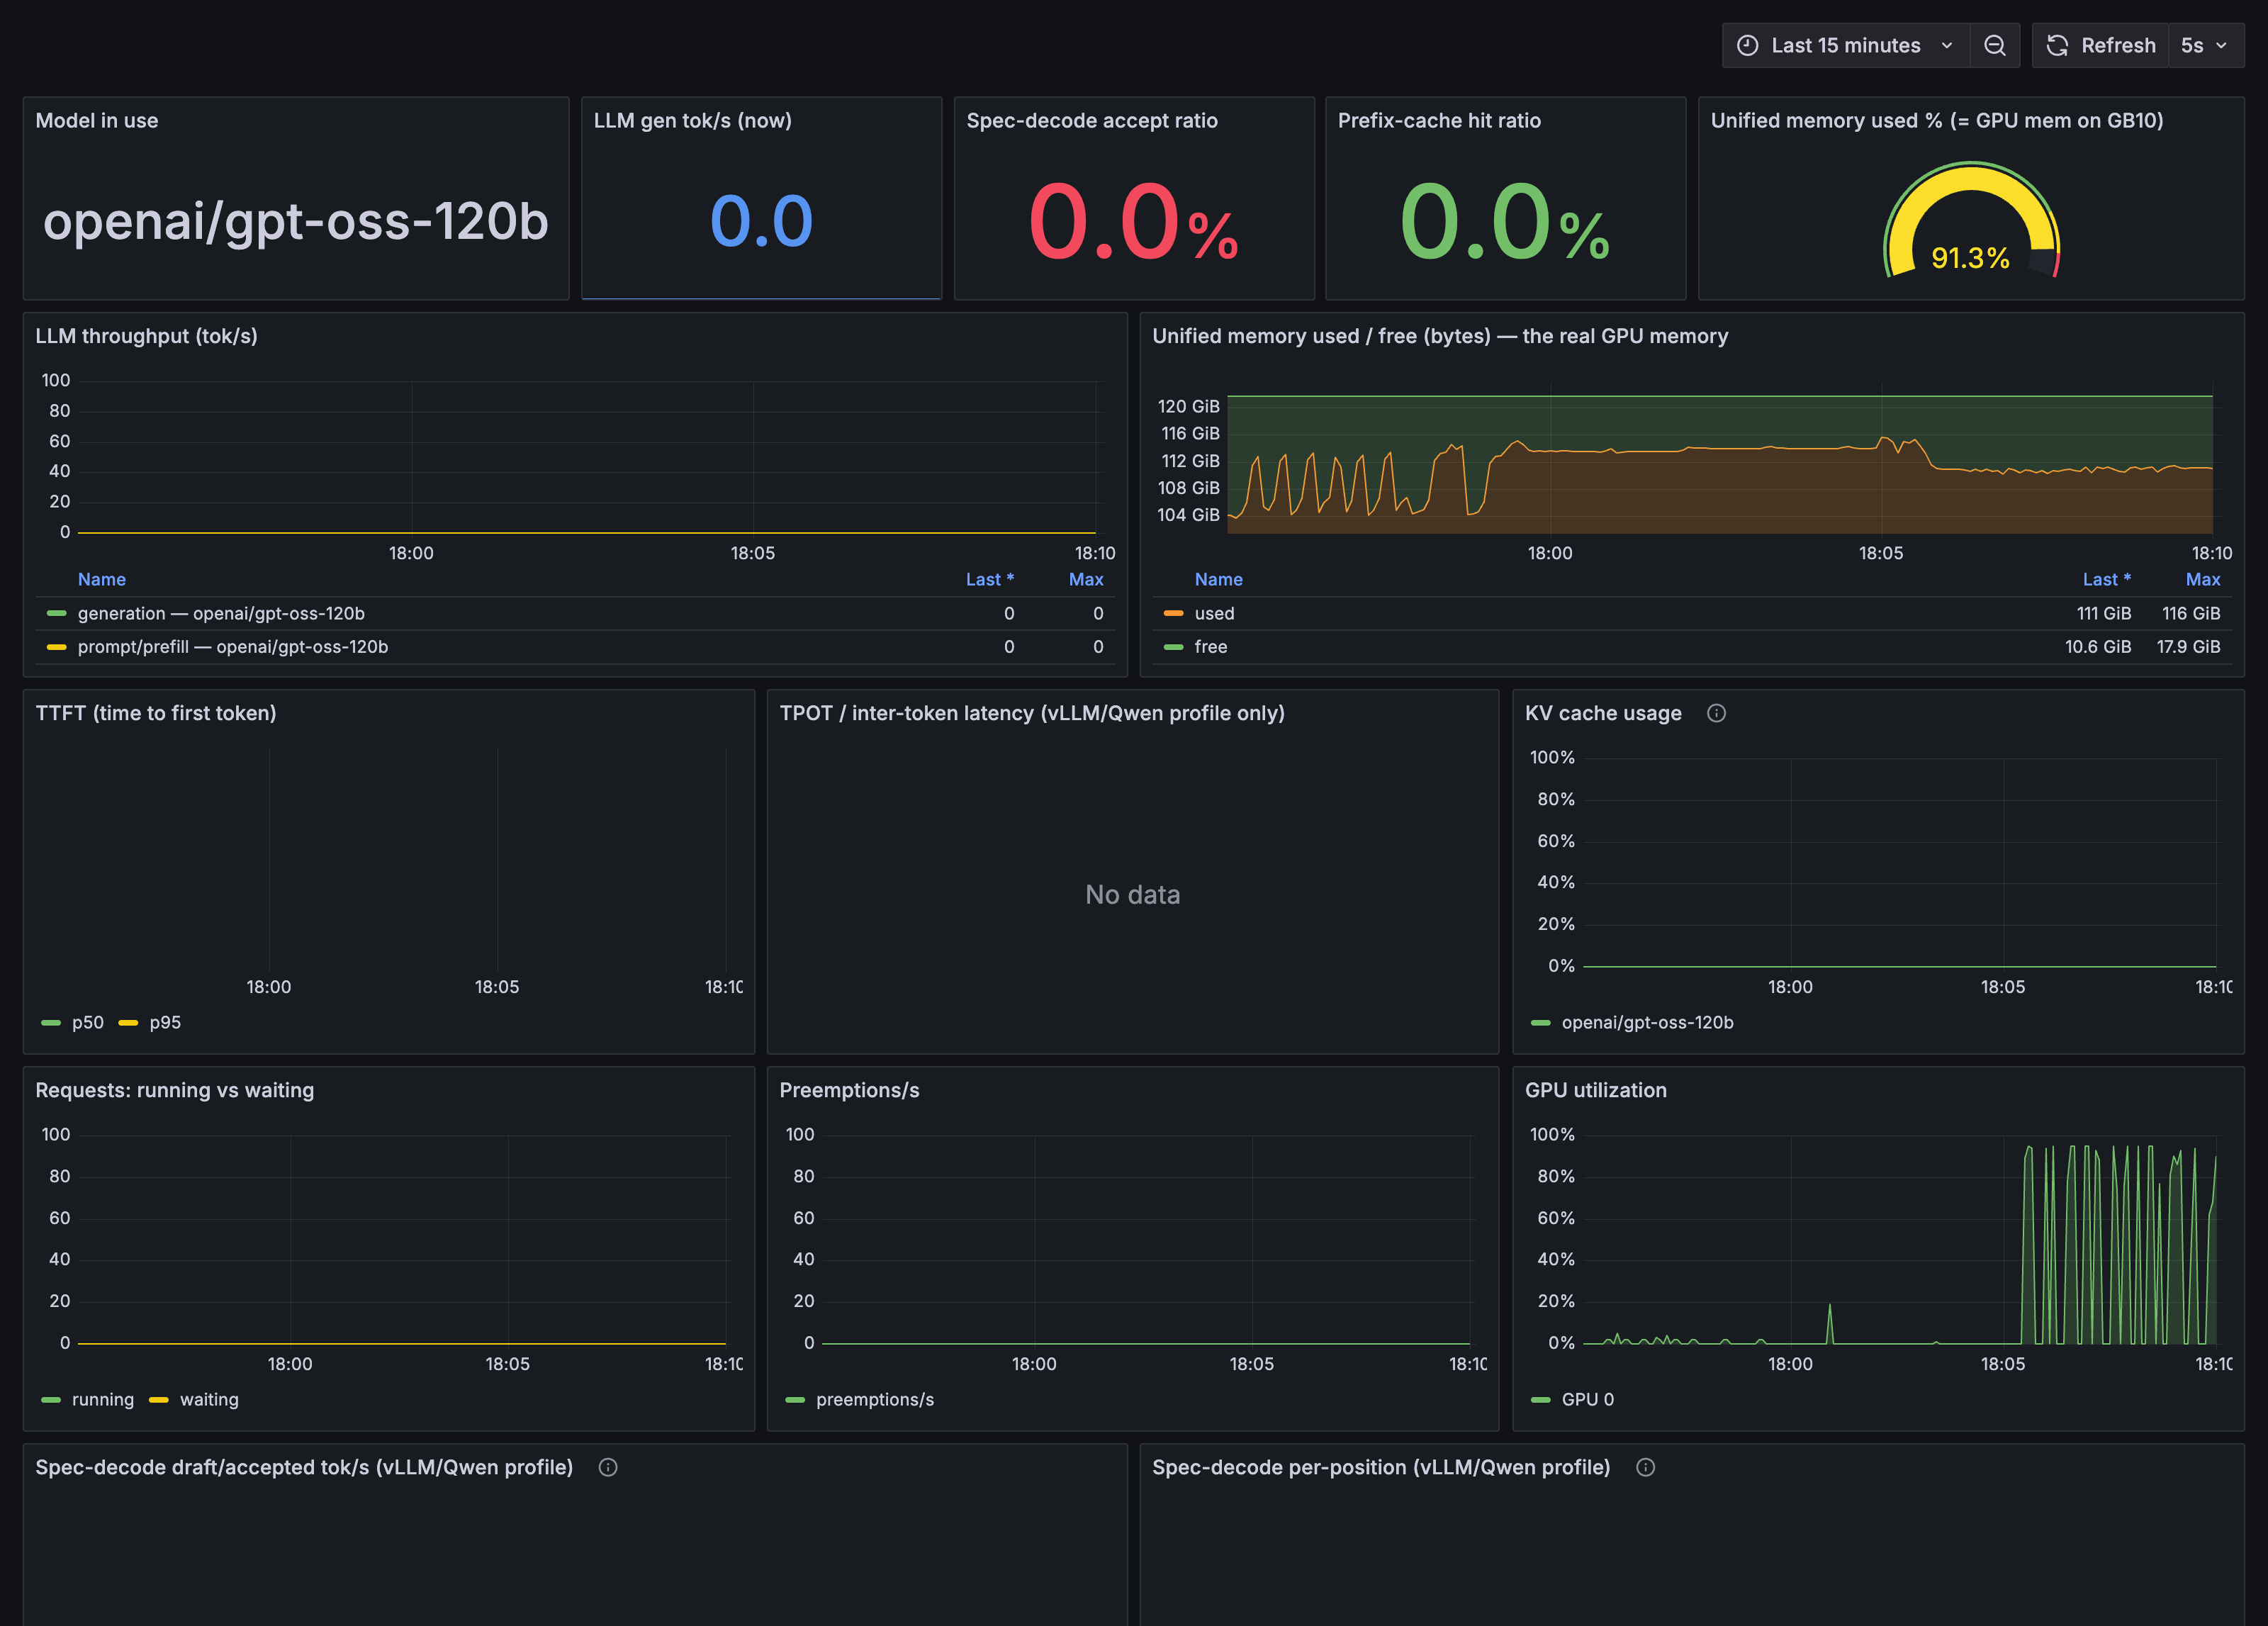
We wrote down a rebalancing order, cheapest first: shrink the GLM-OCR pool from 16,105 to 8,192 tokens (about 0.5 GiB, OCR sequences are short), then the LLM KV pool from 209k to about 90k (about 1.8 GiB, at the cost of an eight-minute LLM restart), then stop the query-time reranker during bulk ingest (2.4 GiB, it isn't on the extraction path). No configuration OOM'd once swap was in place; the real limit was throughput, not memory.
The boot saga
Every docker compose up -d triggered the same cascade on the language-model container during weight load, measured rather than estimated:
| Time | Used | Available | What is happening |
|---|---|---|---|
| 12:30:20 | 8.9 GiB | 112 GiB | app stack up, LLM container created |
| 12:30:36 | 75 GiB | 46 GiB | 15 of 15 shards loaded in under a second (mmap'd) |
| 12:31:53 | 85 GiB | 36 GiB | SGLang allocating CUDA buffers and the KV pool |
| 12:35:14 | 111 GiB | 10 GiB | still climbing |
| 12:36:00 | 120 GiB | 1.5 GiB | the kernel OOM-killer fires |
| 12:36:15 | 69 GiB | 52 GiB | scheduler SIGKILL'd, exited(1) |
The model's weights are 61 GB. SGLang holds them twice during load: roughly 60 GB device-resident in the unified pool (not charged to the container's cgroup) plus about 55 GB of host staging memory while the copy happens, around 115 GB transient on a 121 GiB box with the OS and app stack already resident.
My first theory was Linux page cache holding the mmap'd safetensors files. Wrong: dropping caches freed nothing, Cached was only about 20 GB and already reclaimable, and container memory limits don't help either, since the device half of the double-buffer isn't cgroup-charged. The fix was dull: a 64 GB swapfile on top of the stock 16 GB, plus vm.swappiness=100. The weights now materialise in about 420 seconds, spilling to swap the whole way, and the loader hasn't been killed since. install.sh auto-provisions at least 48 GiB of swap before it touches the model layer.
The second problem was a semantics trap: SGLang's --mem-fraction-static is a fraction of the memory free at startup, while vLLM's --gpu-memory-utilization is a fraction of the total. The three SGLang servers load serially, so each inherits a smaller free pool than the last, and the later fractions have to be larger.
# Serial load on a ~121 GiB unified pool. Fractions are of FREE-at-startup.
LLM_MEM_FRACTION=0.64      # LLM first, ~112 GiB free  -> weights 66.86 GiB, KV pool 209,055 tok
EMBED_MEM_FRACTION=0.30    # after the LLM, ~43 GiB free -> 0.10 gave 4.3 GiB < 8.2 GiB of weights
RERANK_MEM_FRACTION=0.15   # last, ~30 GiB free -> ~4.5 GiB for a 0.6B model
0.10 of 121 GiB total works out to 12 GiB. SGLang gave the embedding server 4.3 GiB instead and refused to start with "Not enough memory. Please try to increase --mem-fraction-static".
The same trap has a nastier version. The shipped bundle carried LLM_MEM_FRACTION=0.58, which in that boot order left a KV pool of only 2,667 tokens. A single real extraction prompt is 4,221 tokens, so every chunk came back 400-rejected and all extraction failed silently. Raising it to 0.64 gave the 209,055-token pool. An earlier measurement, with the LLM loading first into a nearly empty box at 131,072 context, had that same 0.58 produce about 211,000 tokens instead.
Two more boot hazards, now scripted around. On reboot, restart: unless-stopped containers all start in parallel, since Docker only honours depends_on ordering during compose up, so gpt-oss races the small models for memory and crash-loops. Fix: stop the auxiliaries, sync and drop caches so SGLang sees true free memory, load the LLM first, then bring the others back. Memory went from 115 GiB used, 5 GiB available, 27 GiB swap, to 85 used, 35 available, 4 swap.
Separately, the GB10's SM clock can stick at 611 MHz against a maximum of 3,003 MHz, GPU in P0, drawing about 10 W at roughly 18 tok/s; nvidia-smi -lgc is accepted and ignored. Only a reboot clears it, back to 2,548 MHz and about 50 tok/s single-stream. Every throughput number taken before finding it was around 5x too slow and had to be thrown away.
Four bugs that only showed up on real hardware
We ran install.sh end to end on the actual appliance, blank USB stick to working stack, and it surfaced four defects a laptop test would never catch.
The licence file dropped next to the installer was never copied into the install directory during staging, so the stage-1 check failed despite a perfectly valid licence. Stage-1 health probes curl localhost:38003; setting BIND_HOST to the Tailscale address alone published the ports there only, so the probe got connection-refused while the API was healthy. Bind to 0.0.0.0 on the appliance.
The third bug's cause was ordinary. A cold load of gpt-oss-120b on unified memory takes 8 to 10 minutes: 5.7 minutes of MXFP4 weight loading, then CUDA-graph capture, piecewise graph compilation over 58 token buckets, then warmup. The healthcheck's start_period was 300s, expiring around seven and a half minutes in: the container was marked unhealthy, embedding and reranker never started, and compose up --wait tore the stack down mid-load. Raising it to 900s fixed every boot after that.
vllm_llm:
  healthcheck:
    start_period: 900s   # was 300s; cold MXFP4 load is 8-10 min on GB10
The fourth was a parser fall-through: RAGAnything has no GLM-OCR parser class, so parser='glmocr' fell through to the MinerU parser, whose install check needs a local MinerU CLI or API endpoint. Neither exists on a GLM-OCR box, so the check returned false and every knowledgebase creation failed with "Parser ParserType.GLMOCR is not properly installed". Since GLM-OCR is worker-delegated and the RAG service never parses anything itself, the fix bypasses the check when a GLM-OCR endpoint is configured.
What it does when it runs
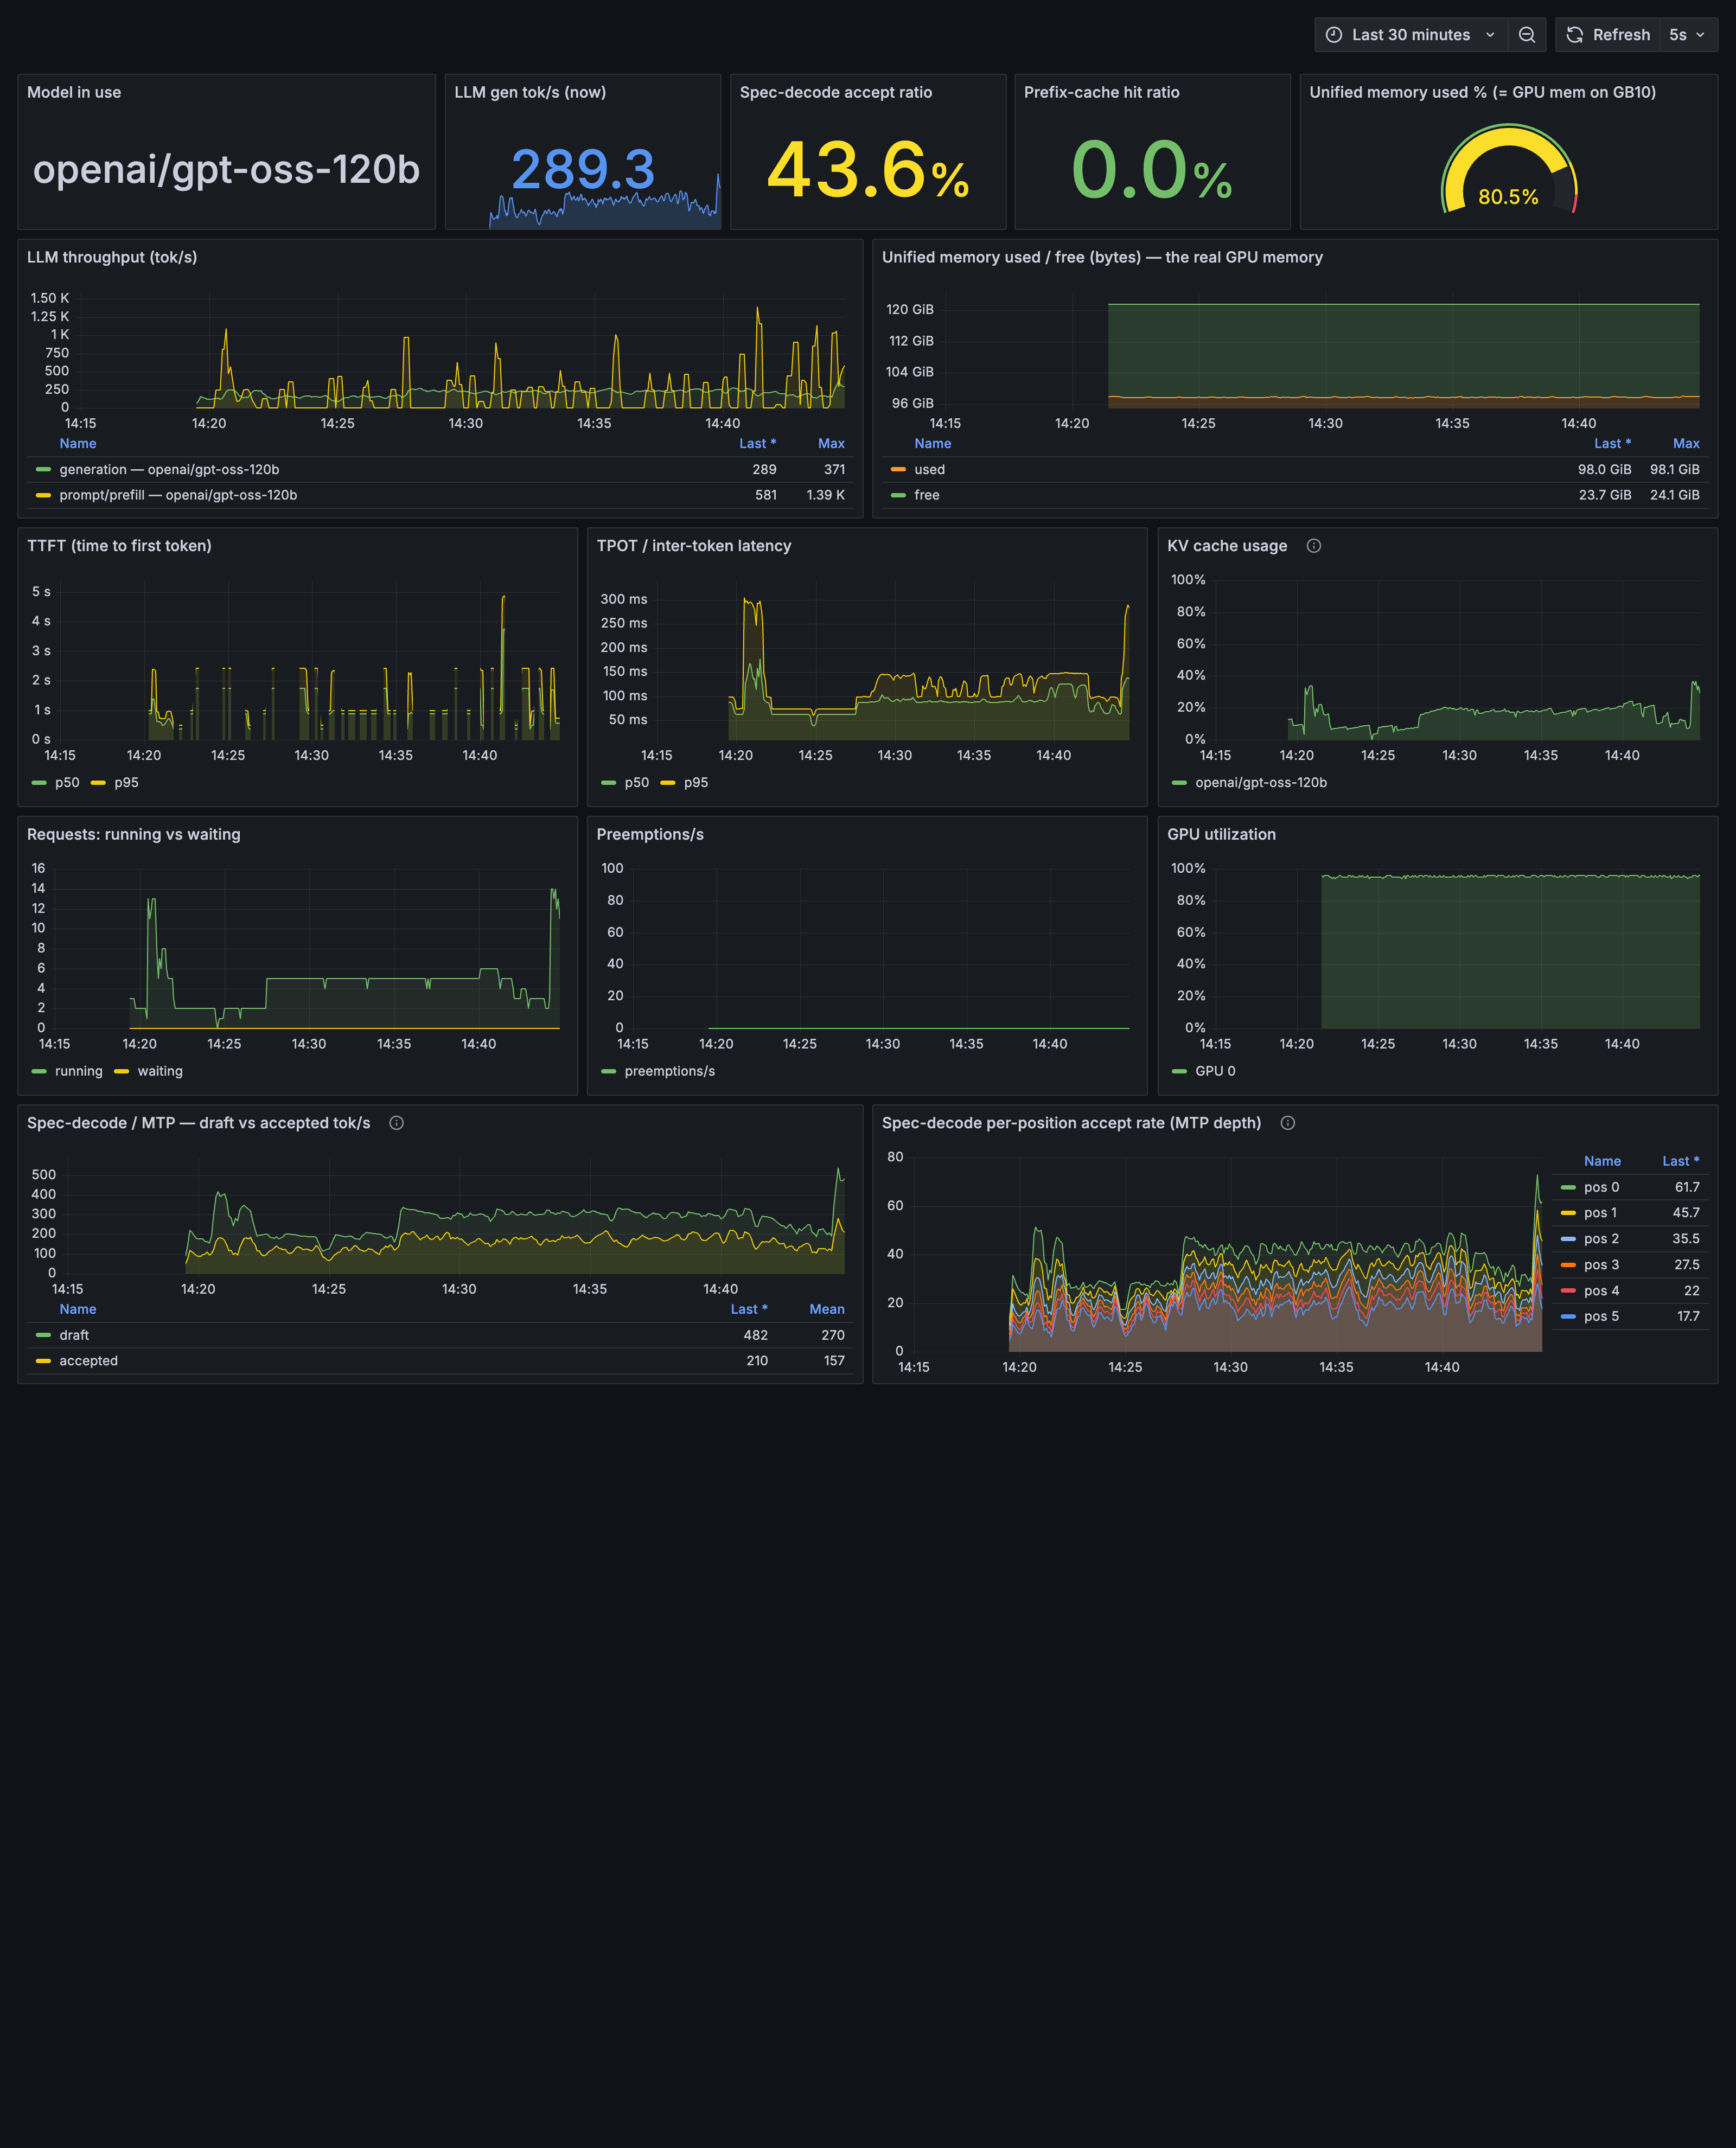
Single-stream, gpt-oss-120B is the slowest model on this box: 61.4 tok/s, and 50 tok/s on a direct 500-token generation after the clock-bug reboot. It also gains most from concurrency, reaching 2,621 tok/s at 128 concurrent requests, a 42.7x gain on identical silicon (why, and why single-chat benchmarks mislead, in Your DGX Spark isn't slow. You're testing it wrong.).
The extraction path shows a smaller ramp, measured after the reboot:
| Concurrency | Aggregate tok/s | Per request | GPU clock |
|---|---|---|---|
| 1 | 20 | 20 | 2,515 MHz |
| 4 | 57 | 14 | 2,489 MHz |
| 8 | 96 | 12 | 2,476 MHz |
| 16 | 170 | 11 | 2,470 MHz |
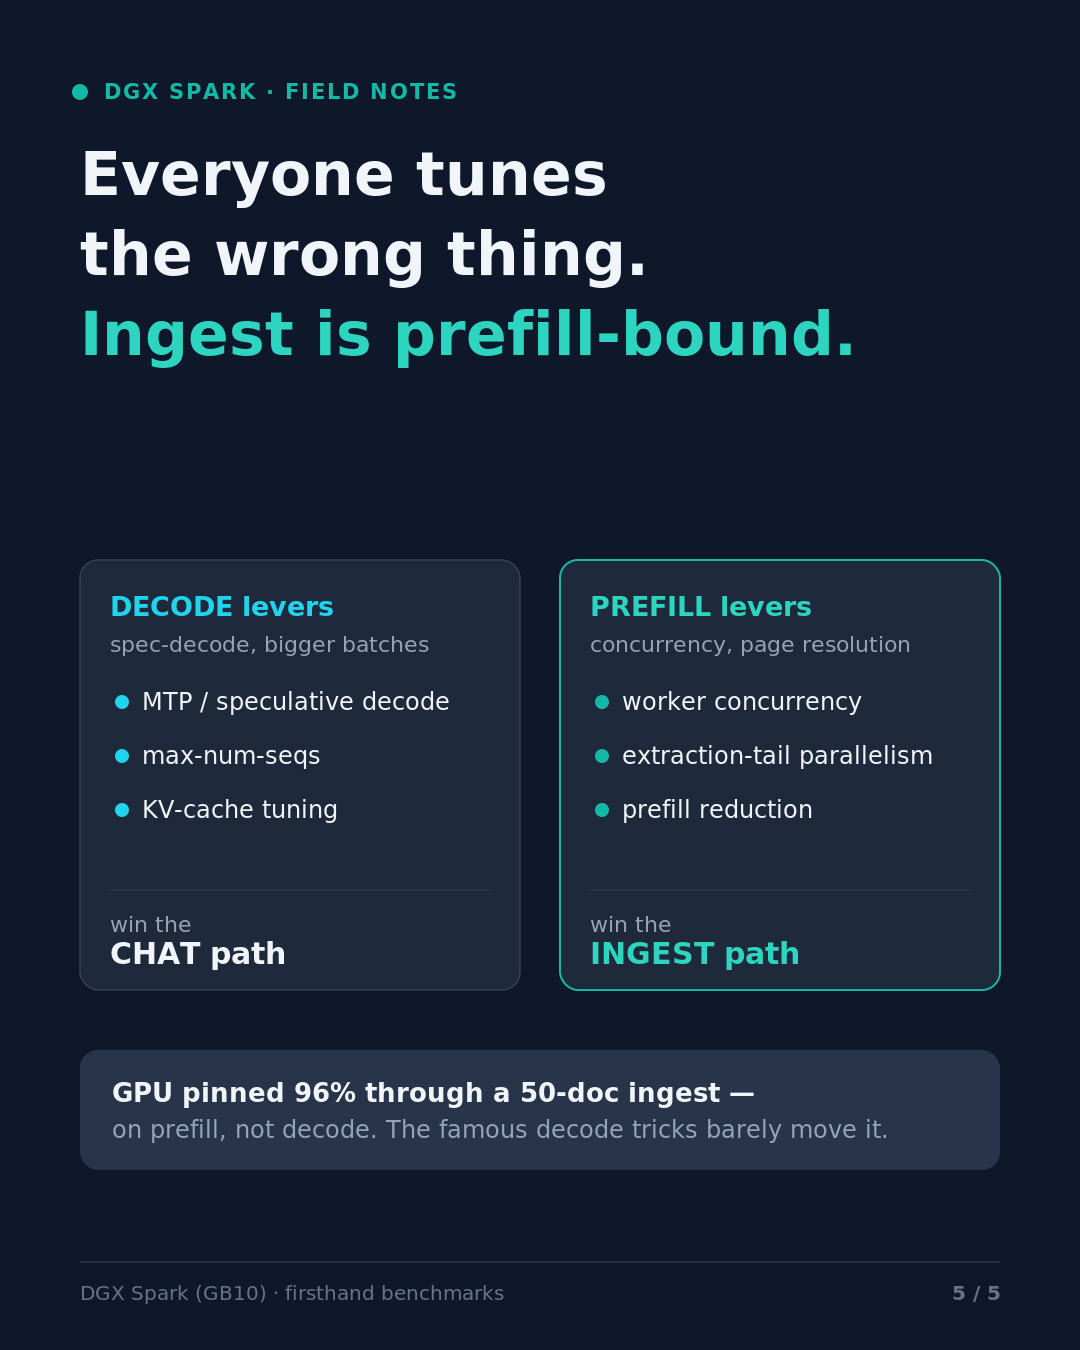
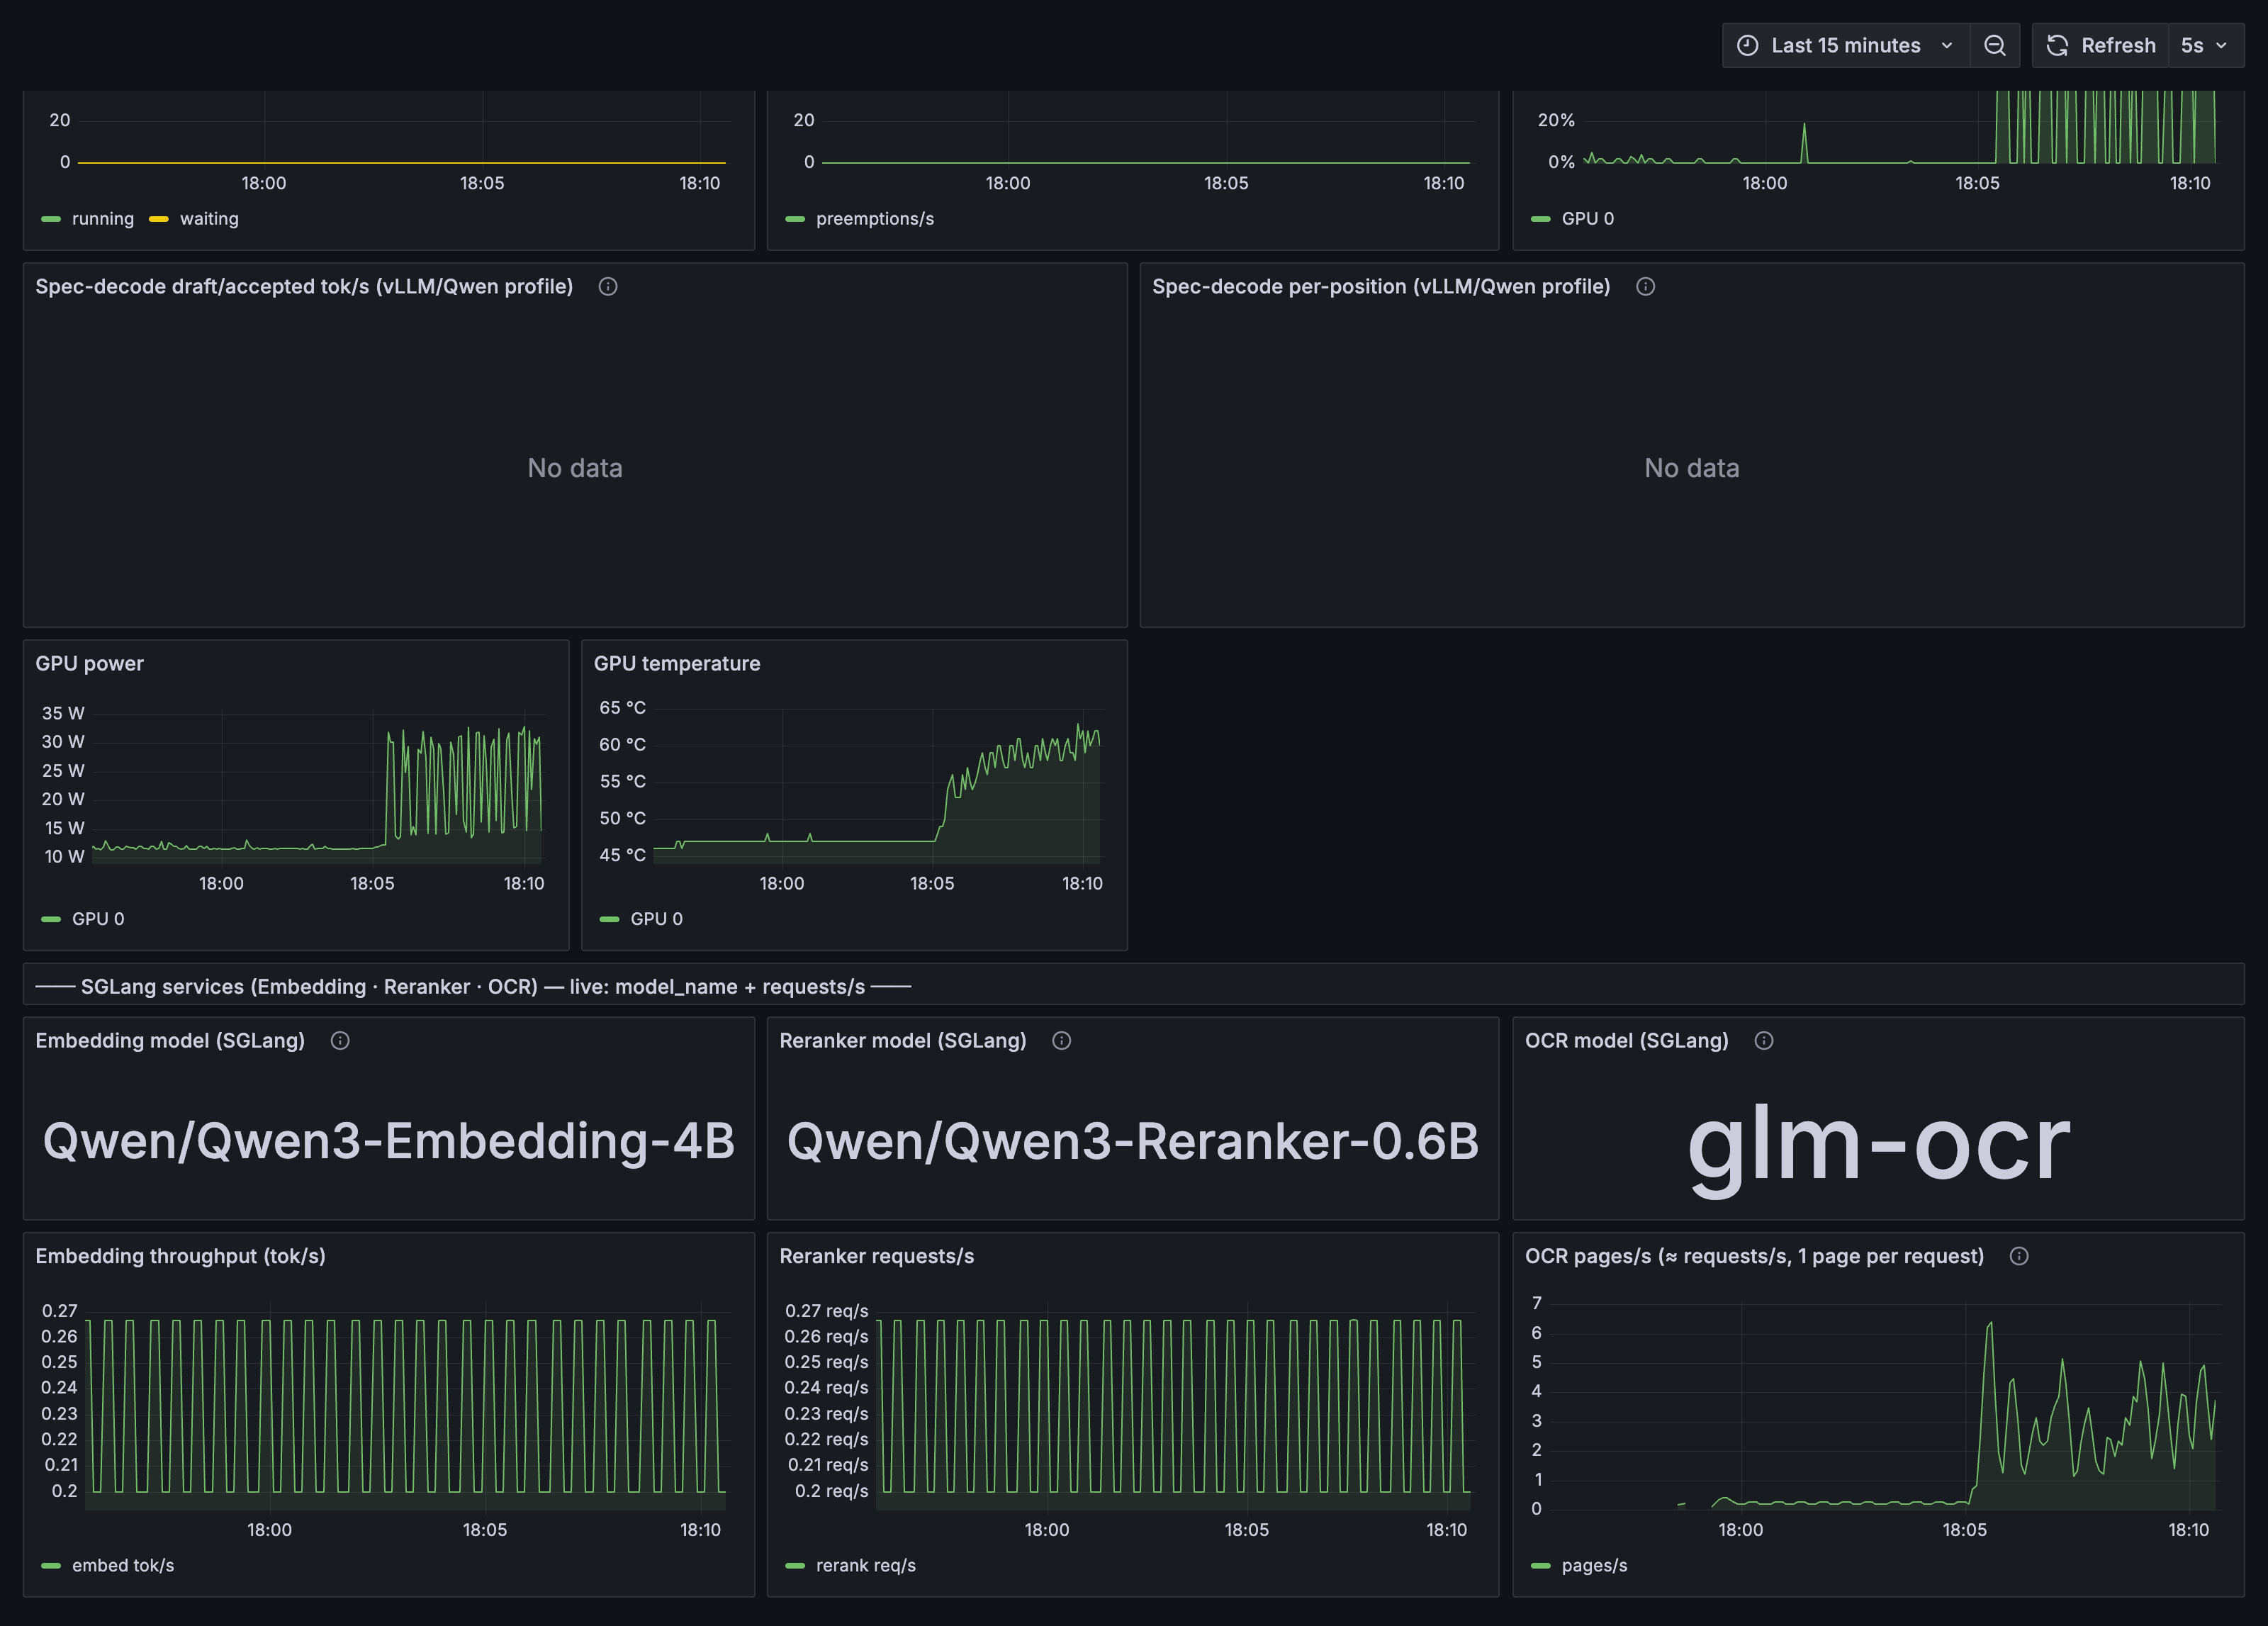
About 8.5x from batching, GPU at 96% utilisation, roughly 48 W and 2.5 GHz: memory-bandwidth-bound. Extraction feels heavy because of the prompts: real LightRAG extraction requests run a median 1,974 new tokens, a p90 of 4,532 and a maximum of 7,611, and gpt-oss emits hidden reasoning on top of that. On a single extraction call: default reasoning effort, 781 completion tokens, 1,400 characters of reasoning, 57.5 s; low, 532 tokens, 56 characters, 39.5 s; high, 2,316 tokens, 6,322 characters, 127 s.
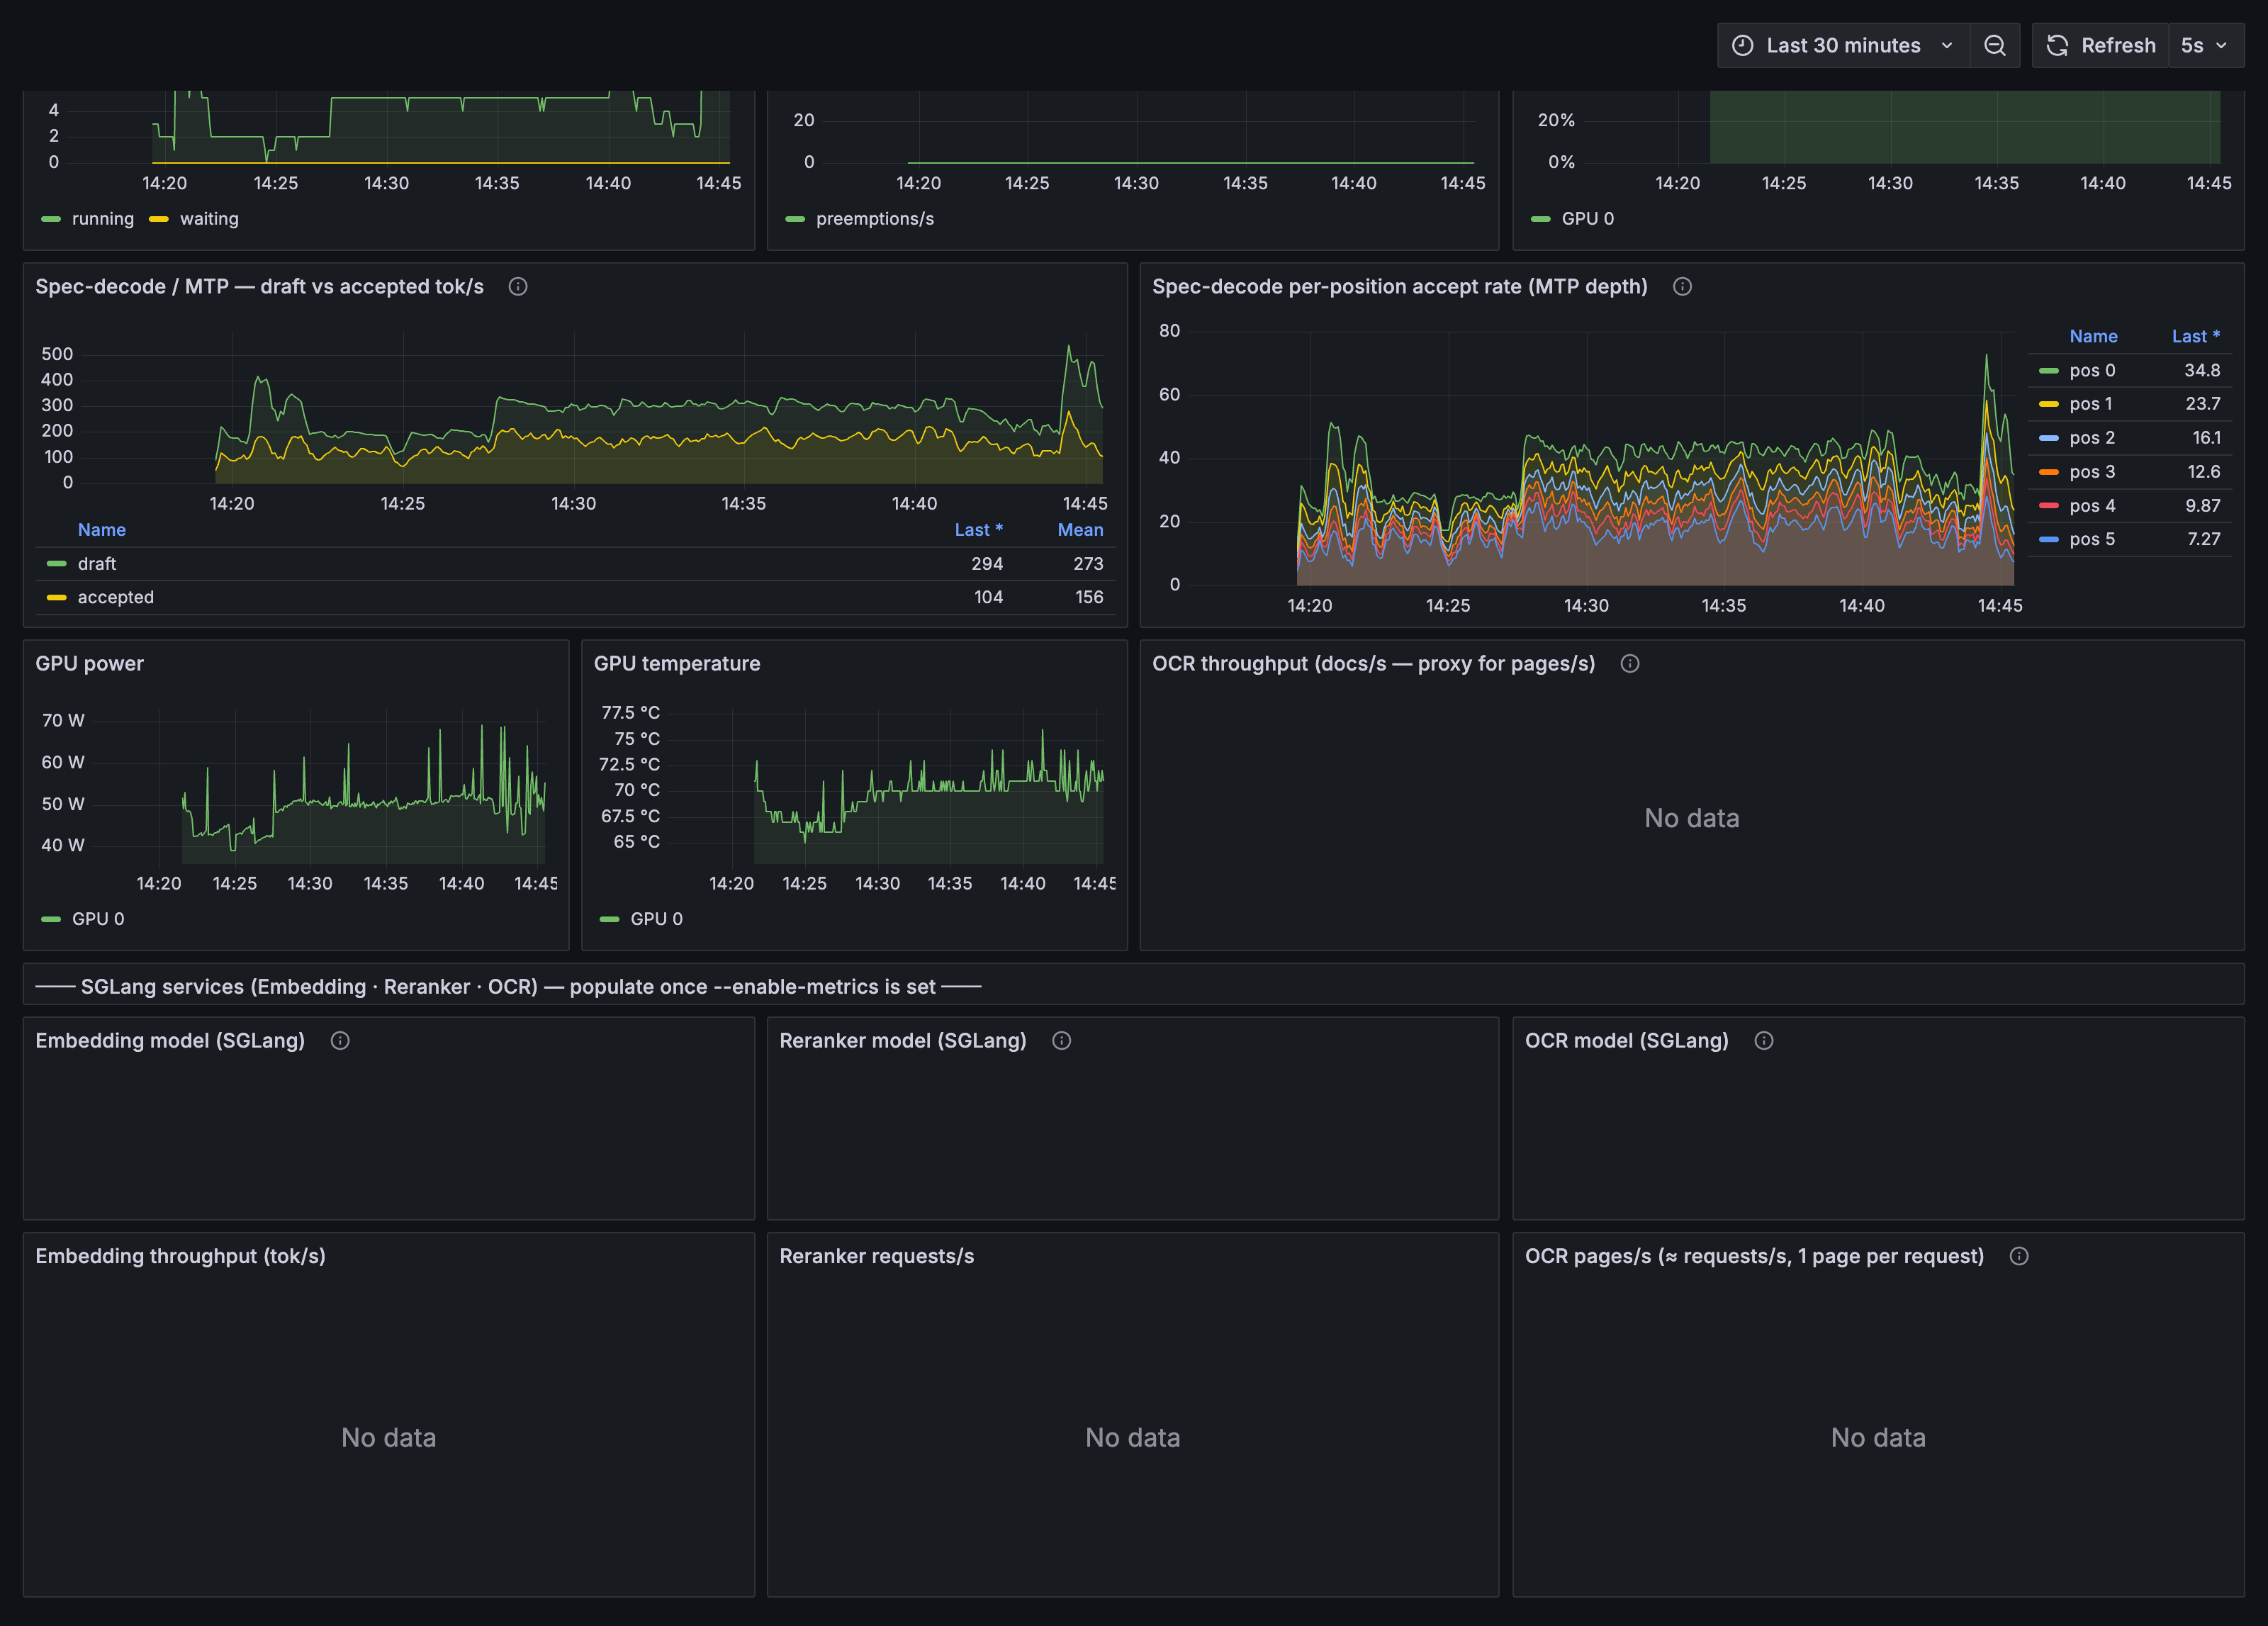
On the document pipeline, the dedicated OCR model is the good news: GLM-OCR reads a page in 0.42 s, putting the OCR phase of a 100-document, 392-page corpus at roughly 43 minutes, about 139 documents per hour, 0.15 pages per second. Extraction is where the time goes. On three HR and policy PDFs run to completion at extraction concurrency 2: gpt-oss took 19m20s for 123 entities and 167 relations at 111 GB used; Qwen3.6, thinking off with a looped gleaning pass, took 4m44s for 172 entities and 194 relations at 81 GB.
The full 100-document end-to-end figure for gpt-oss is a projection, not a measurement, since that run was never driven to completion: about 11 minutes per document extrapolates to roughly 18 hours, around 5.5 documents per hour. I'd rather say so than dress the arithmetic up as a result.
The verdict
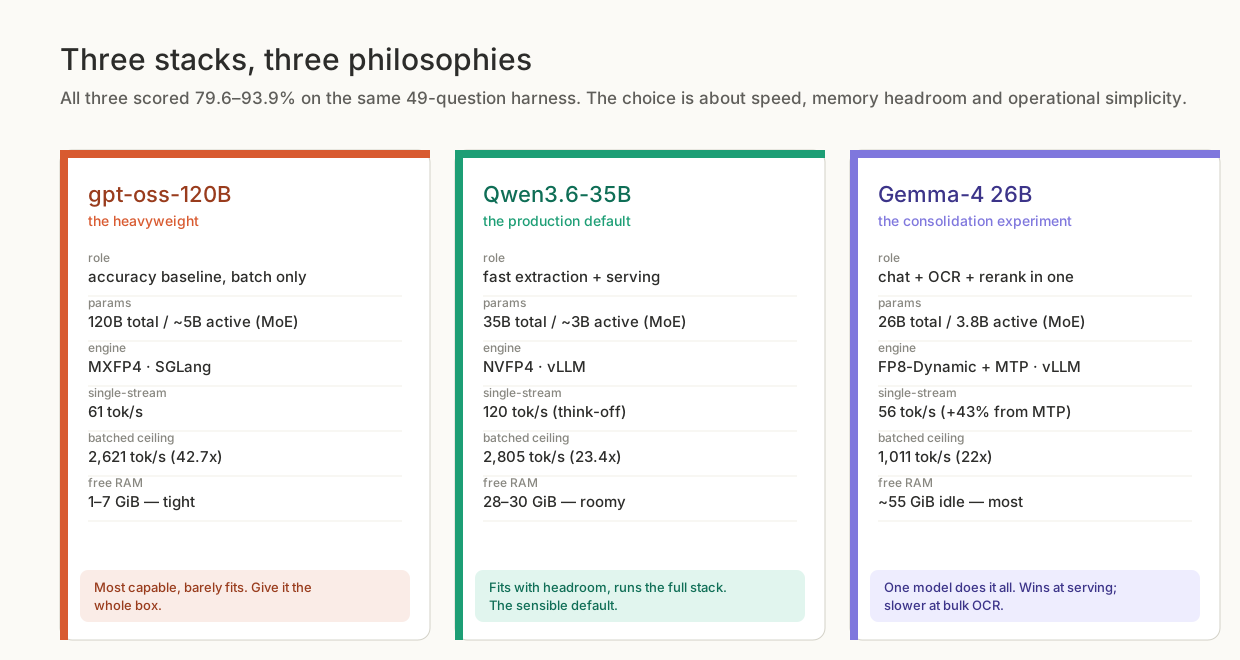
gpt-oss-120B belongs on this box for dedicated, accuracy-critical batch work: hand it the whole machine, strip the stack down, walk away for a few hours. It doesn't belong under a live product, and it isn't the sensible default. Qwen3.6-35B does the same job about four times faster with 28 to 30 GiB of headroom instead of 1 to 7.
gpt-oss went into this study as the quality baseline. It scored 79.6% on our 49-question test set, against Qwen3.6's 93.9% and Gemma-4's 91.8%. Some of that gap is methodology: the gpt-oss and Qwen rows isolate extraction, with a common answer model reading both graphs, while Gemma's row is one model doing the whole job. Some of it is that fixing the gleaning loop, which had been running exactly once regardless of its configured value, let a much smaller model out-recall the big one, moving the accuracy numbers more than the choice of model did.
If you want to reproduce the tight configuration: 0.64 for the language model's memory fraction, 0.30 for embedding and 0.15 for the reranker, at least 48 GiB of swap provisioned before the model layer, a 900s healthcheck start period, and a boot-time ordered load instead of unless-stopped. Get one of those wrong and you're back at the boot loop that opened this article.