Running the whole RAG stack on a MacBook, one Colima VM per worktree
What really runs locally on Apple Silicon: a VM per git worktree, a pgvector SIGILL that never showed on OrbStack, and a PaddleOCR segfault we never fixed.
Our RAG platform is 13 container images and a 19-container stack, all running on a laptop. I proved that on 27 June 2026, inside a single 16 GB Colima VM, with the host's own stack still running untouched next to it.
Getting there cost a compiler flag I did not know existed, an OCR library with no fix, and hours lost to a test suite that died quietly while looking busy.

Each branch gets its own machine
I keep several git worktrees open at once and want a coding agent to build and test in any of them without co-ordinating with me or the others. Running N stacks on one Docker daemon works until one worktree runs docker system prune or blows up on RAM, and every other stack dies with it.
So I wrote vmoat, a POSIX shell CLI plus a Claude Code plugin that gives each worktree its own ephemeral Colima VM, with its own Linux kernel and Docker daemon, public under MIT since 27 June 2026.
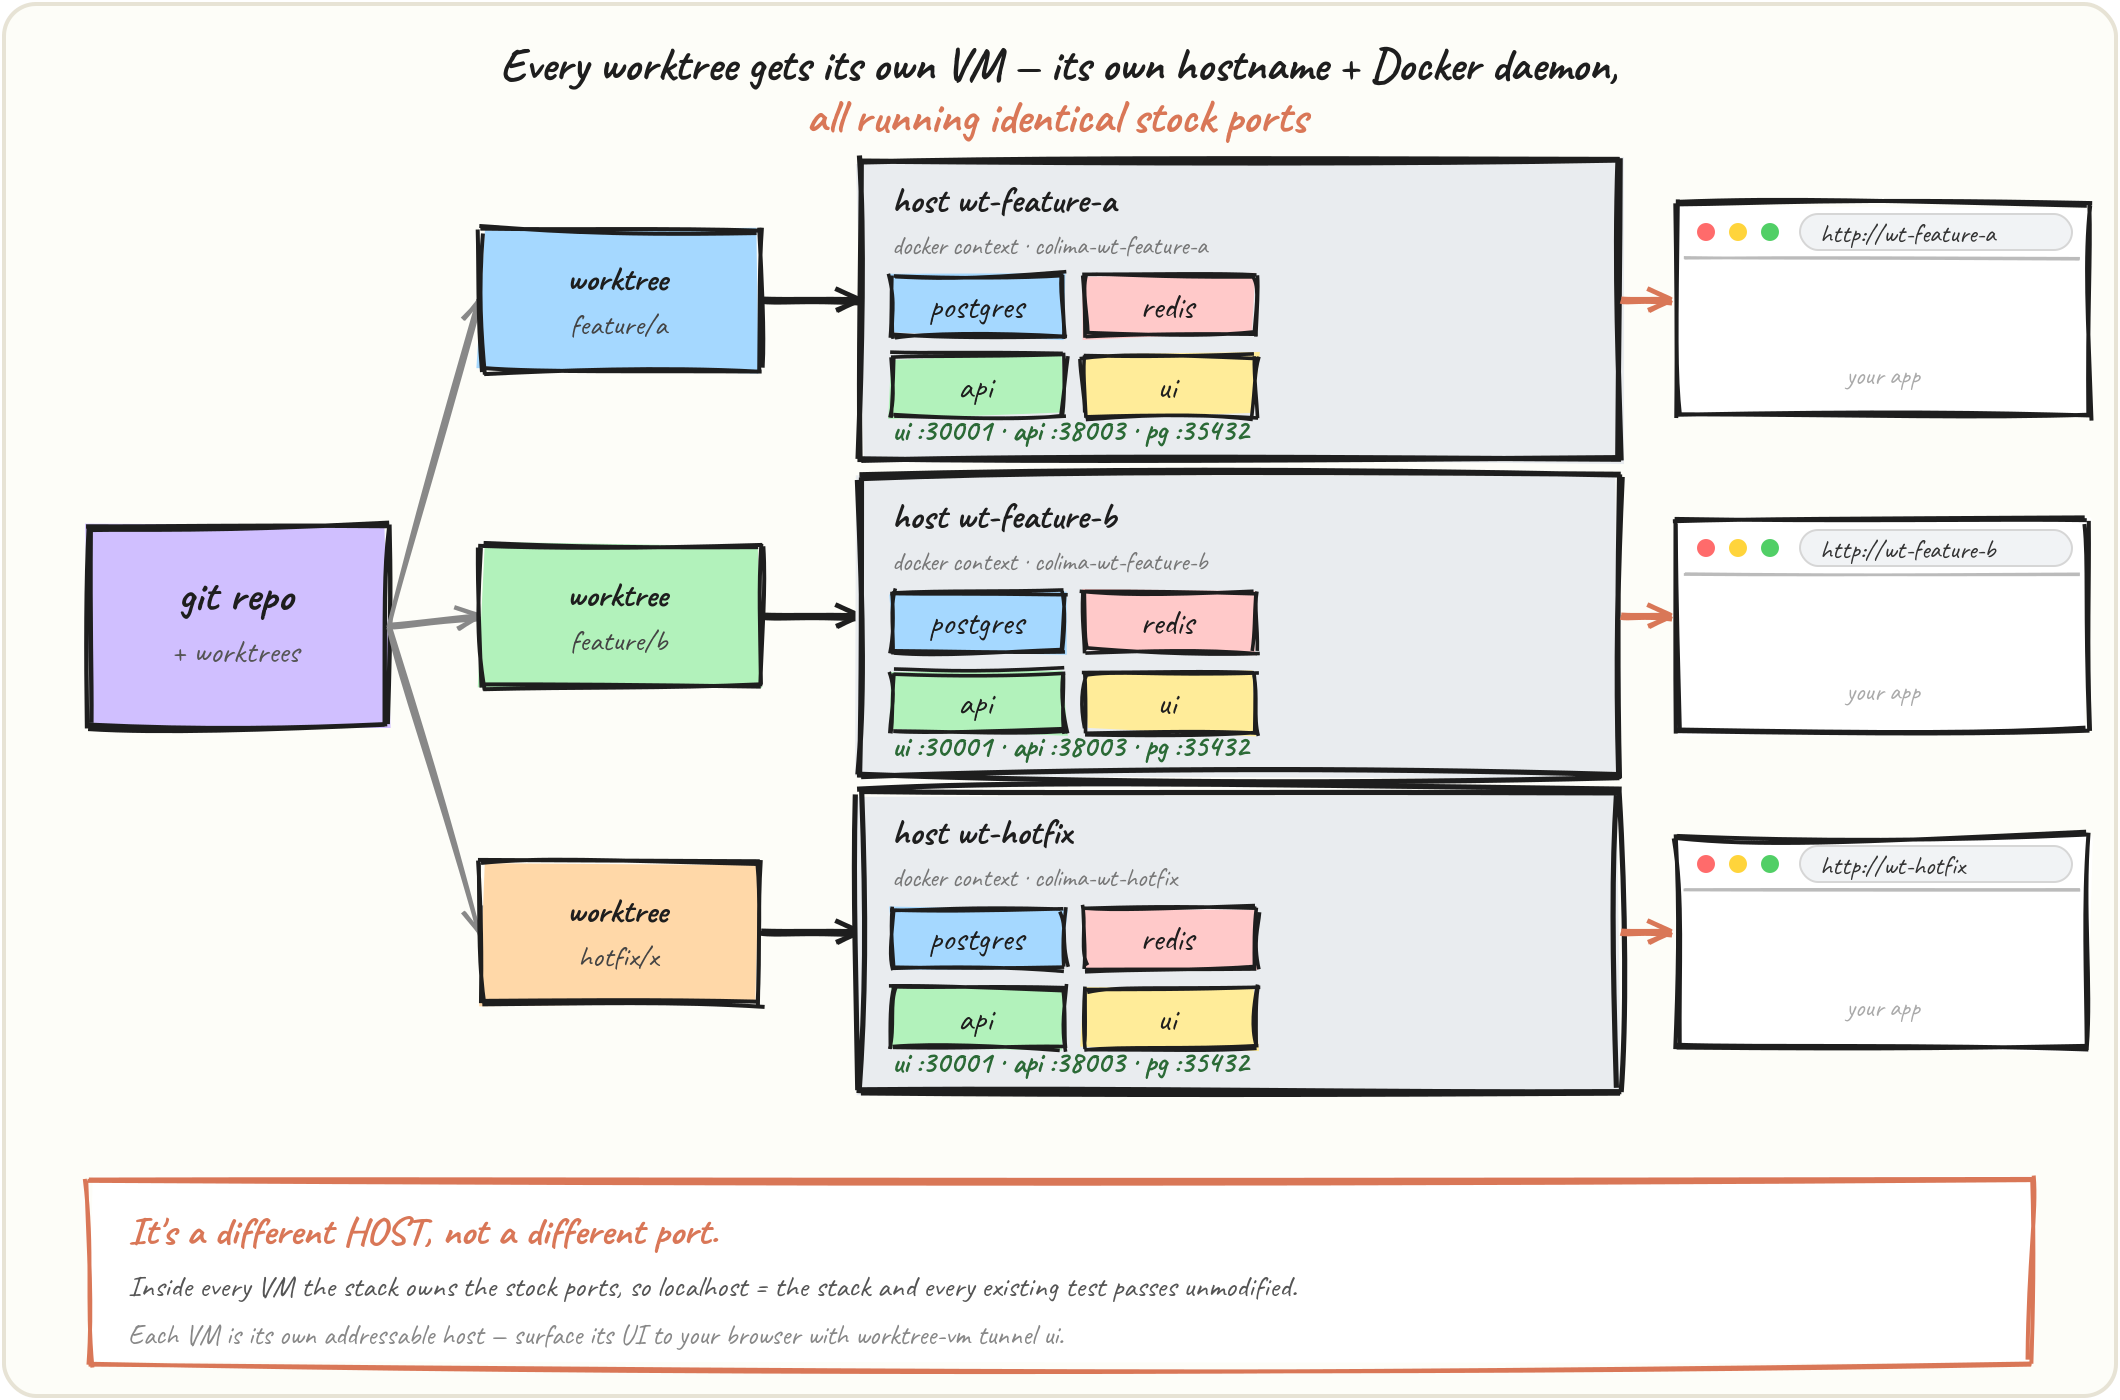
Inside each VM the stack owns the default ports, so localhost:38003 is the agent API and our existing test suite runs unmodified, hardcoded localhost URLs and all: no port-juggling patch, no test-only compose overlay.
A short shell-sourced config at the repo root drives it:
VM_CPU=6
VM_MEMORY=24
VM_DISK=80
VM_MOUNT="$HOME/github"

CMD_UP="INSTANCE_NAME=local VERSION=local ./deploy.sh local"
CMD_TEST="INSTANCE_NAME=local VERSION=local ./deploy.sh test"

HEALTH_URL="http://127.0.0.1:38003/health"
HEALTH_TIMEOUT=1800
EXPOSE_PORTS=(30001 38003)
vmoat up creates the VM and runs ./deploy.sh local inside it; vmoat tunnel SSH-forwards the admin UI and API to the host so Chrome can drive them; vmoat destroy deletes the VM and everything in it. The config is optional: without one it auto-detects a compose file, a Makefile up: target or an npm dev script, and works out which ports to tunnel.
Those two INSTANCE_NAME=local VERSION=local pins work around a real deploy.sh bug: it forces both variables in local mode but not test, so the compose project name fell back to the worktree directory and collided on ports with the running stack. Validating vmoat also turned up a second bug, a slot network created without its com.docker.compose.network=default label that a fresh clone refused to adopt.
RAM sets the concurrency ceiling
That corrects the marketing version of my own tool: the comment in vmoat.conf puts the real ceiling at roughly 2 to 3 concurrent VMs at 16 GB each on a 64 GB Mac, and I raised our default to 24 GB per VM because rag_worker alone carries a 14 GB limit for heavy ingest and extraction runs.
The claim "eight parallel worktrees" floats around; I have not measured eight. What I have measured: one VM carrying the full 13-image build and a healthy 19-container stack, ./deploy.sh test --quick passing inside it, and the admin UI returning HTTP 200 on the host through the tunnel.
The first up is slow, around 12 to 15 minutes: the heavy base image with torch and LibreOffice has to build, and no image cache is shared between VMs. Disk is the other cost, since every VM keeps its own copy of every image, which is why VM_DISK is 80.
Measurement needed: cold
vmoat upto health-check-passing, timed across a 16 GB VM and a 24 GB VM, and separately on an M1 versus this M5 Max. The 12-15 minute figure is one observation from June 2026.
Measurement needed:
./deploy.sh localrebuild time on the host Docker daemon versus inside a vmoat VM, to quantify the virtiofs mount overhead.
One compiler flag broke pgvector, only inside the VM
CREATE EXTENSION vector failed hard under Colima: signal 4, SIGILL, illegal instruction. The same image had run fine for months on the host under OrbStack.
My first hypothesis was wrong: I assumed the VM's CPU model was too restricted and tried switching Colima's backend from vz to qemu with --cpu-type max. It still SIGILL'd.
pgvector's Makefile defaults OPTFLAGS to -march=native, baking the build machine's instruction set into the binary, which then dies anywhere the run CPU differs: under Colima's vz restricted ARM64 model, under qemu, or on any host older than the CI builder's silicon. OrbStack passed the host CPU straight through, so it never noticed. The fix is one word in the Dockerfile:
RUN cd /tmp \
    && git clone --branch v0.8.0 https://github.com/pgvector/pgvector.git \
    && cd pgvector \
    && make OPTFLAGS="-O2" \
    && make install \
    && rm -rf /tmp/pgvector
-O2 drops -march=native and lets pgvector use each architecture's baseline SIMD, NEON on ARM and SSE2 on x86, so the same image runs everywhere. Shipped as commit 800df0ac on 28 June 2026, validated on both OrbStack and the Colima VM.
Where the shared mount bites
The VM mounts the host worktree directly, writable, at the same path: fast, and the source of the two nastiest traps.
Landing a commit while an in-VM test suite runs hot-reloads the FastAPI services mid-run, since uvicorn watches that shared mount in local mode; Celery workers do not reload, so the stack ends up mixed-version and a dead run keeps polling without failing, it just goes quiet. A 60-minute run was ruined this way on 12 July 2026, taking an hour to diagnose because "queue depth 0, workers idle, test process at 0% CPU" looks like a slow suite unless you're watching closely. Land commits before the suite starts or after it ends.
./deploy.sh test decrypts our dotenvx-encrypted .env under an EXIT/INT/TERM trap, so the host-side worktree holds plaintext while the suite runs, and killing one test child does not fire the trap. Signal the whole process group, then check every value is back to encrypted:.
A smaller trap that costs an afternoon: a fresh VM has an empty Postgres, so the admin password in the repo's gitignored .password file returns a 401 against the tunnel, though it is correct for the host stack. Reset the admin user inside the VM through the app's own hasher, then prove it with a real login call before recording any browser verification.
PaddleOCR does not run on Apple Silicon
It loads five models cleanly, then hard-crashes on the first predict() call with SIGSEGV at address 0x0, a null pointer dereference inside PaddlePaddle's C++ inference engine, exit code 139.
| Stage | ARM64 result |
|---|---|
| PaddlePaddle install, PaddleOCR import and init | works |
| Model download and caching (5 models) | works |
| pdf2image and poppler integration | works |
First PaddleOCR.predict() call |
SIGSEGV, exit 139 |
Confirmed on 17 February 2026 against PaddlePaddle 3.2.2 aarch64, PaddleOCR 3.4.0 and PaddleX 3.4.2 on Python 3.11. Four workarounds failed: disabling textline orientation, a minimal configuration, different image formats including raw numpy arrays, and PADDLE_PDX_DISABLE_MODEL_SOURCE_CHECK, which made initialisation faster then segfaulted in the same place.
There's nothing on our side to fix: the aarch64 wheels install and import fine, but the C++ kernels underneath were built and tested for x86. So PaddleOCR lives behind an x86_64 RunPod serverless API, and local development that needs it calls out to the cloud. For everything else we use GLM-OCR, the preferred parser for new knowledgebases since June 2026, with MinerU still the configured default and fallback for knowledgebases already ingested with it.
Measurement needed: the cost and latency of that RunPod round trip against a local x86 GPU, and the workload size where one overtakes the other. We picked the API because it worked.
Budgeting a laptop's memory for ingestion
Feeding the running stack a few hundred documents is separate. Our tuning guide for a 64 GB machine puts the peak at roughly 300 MB per document during merge, against about 50 MB during extraction, since extraction batches go to disk rather than accumulate in memory.
| Item | Memory |
|---|---|
| Base system | ~8 GB |
| Redis, admin UI, agent API | ~4 GB |
| Safety margin (20%) | ~10 GB |
| Left for processing on a 64 GB machine | ~42 GB |
At 300 MB per document that arithmetic gives about 140 concurrent documents, and the guide recommends 120. Its configuration:
CELERY_CONCURRENCY=16
MAX_ASYNC=12                  # 16 x 12 = 192 concurrent LLM calls
MAX_PARALLEL_INSERT=8         # 16 x 8  = 128 concurrent documents
EMBEDDING_FUNC_MAX_ASYNC=64
MAX_CONCURRENT_UPLOADS=20
EMBEDDING_BATCH_SIZE=32
The binding constraint there is DeepInfra's limit of 200 concurrent requests per model, not the laptop. The two earlier phases in the guide both sat at 384 concurrent calls and would have been rate-limited; dropping MAX_ASYNC to 12 lands on 192, or 96% of the allowance. Peak memory works out at 128 x 300 MB, which is 38.4 GB.
Our own document contradicts itself here: it calls 38.4 GB a 60% utilisation in the configuration section, then 91% of usable in the safety section, advising to stay under 33.6 GB. The 60% is against the full 64 GB, the 91% against the 42 GB left after overhead; I'd believe the safety section. The throughput figures further down, roughly 1,536 documents an hour theoretical and about 1,100 realistic, are arithmetic from an assumed 5-minute average document, not a measured run.
Measurement needed: an end-to-end ingest of a real 1,000-document knowledgebase on this laptop, with per-phase timings and a worker memory profile. The guide dates from January 2025 and hasn't been re-validated against 2026 hardware or the current pipeline.
What I have not measured, and what I would capture
I want to tell customers what a MacBook does against a DGX Spark, because "it has to stay in the building" is why half of them talk to us. Today I cannot, so I won't dress a spreadsheet up as a benchmark.
A deployment planner in the repo models both platforms, feeding assumptions into a roofline model calibrated to a practical efficiency factor of 0.65 to 0.75 of theoretical. Every figure in it is an input, not a measured result.
| Planner input | M5 Max 128 GB | DGX Spark |
|---|---|---|
| Memory bandwidth | 614 GB/s | 273 GB/s |
| Compute | 50 TFLOPS | 500 TFLOPS |
| Assumed OS overhead | 10 GB | 6 GB |
| Efficiency factor | 0.72 | 0.70 |
The Mac is modelled with 2.2 times the memory bandwidth and one tenth of the compute. Decode at batch size 1 is bandwidth-bound, which flatters the Mac; prefill and anything batched is compute-bound, which does not. The planner's calibration comments cite around 65 to 88 tok/s for a 120B MoE under MLX on an M5 Max and 18 to 25 tok/s for a 70B Q4, against DGX Spark anchors of roughly 59 tok/s for GPT-OSS MXFP4 under vLLM and 14 tok/s for Nemotron-Super Q4. The DGX anchors came from a physical box we own and have instrumented; the Mac ones came from no box of ours.
The captures that would make this a real comparison, all on the machine this was written on (an Apple M5 Max with 128 GiB under macOS 26.4.1, Colima 0.10.3):
- Single-stream decode for one MoE and one dense model under llama.cpp with Metal and under MLX, reporting tok/s and peak resident memory, then the same two models on the DGX Spark under vLLM or SGLang.
- Prefill throughput on a fixed 200-page document set: ingestion is prefill-bound, and decode benchmarks say nothing useful about it.
- Embedding throughput for Qwen3-Embedding-4B over a fixed 1-million-chunk corpus, wall clock and peak memory, against the DeepInfra baseline we pay for today.
- A full 1,000-document knowledgebase ingest, timed per phase (parse, embed, extract, merge), worker memory profile included.
- Cold
vmoat upto healthy on the same commit, at 16 GB and 24 GB VM sizing.
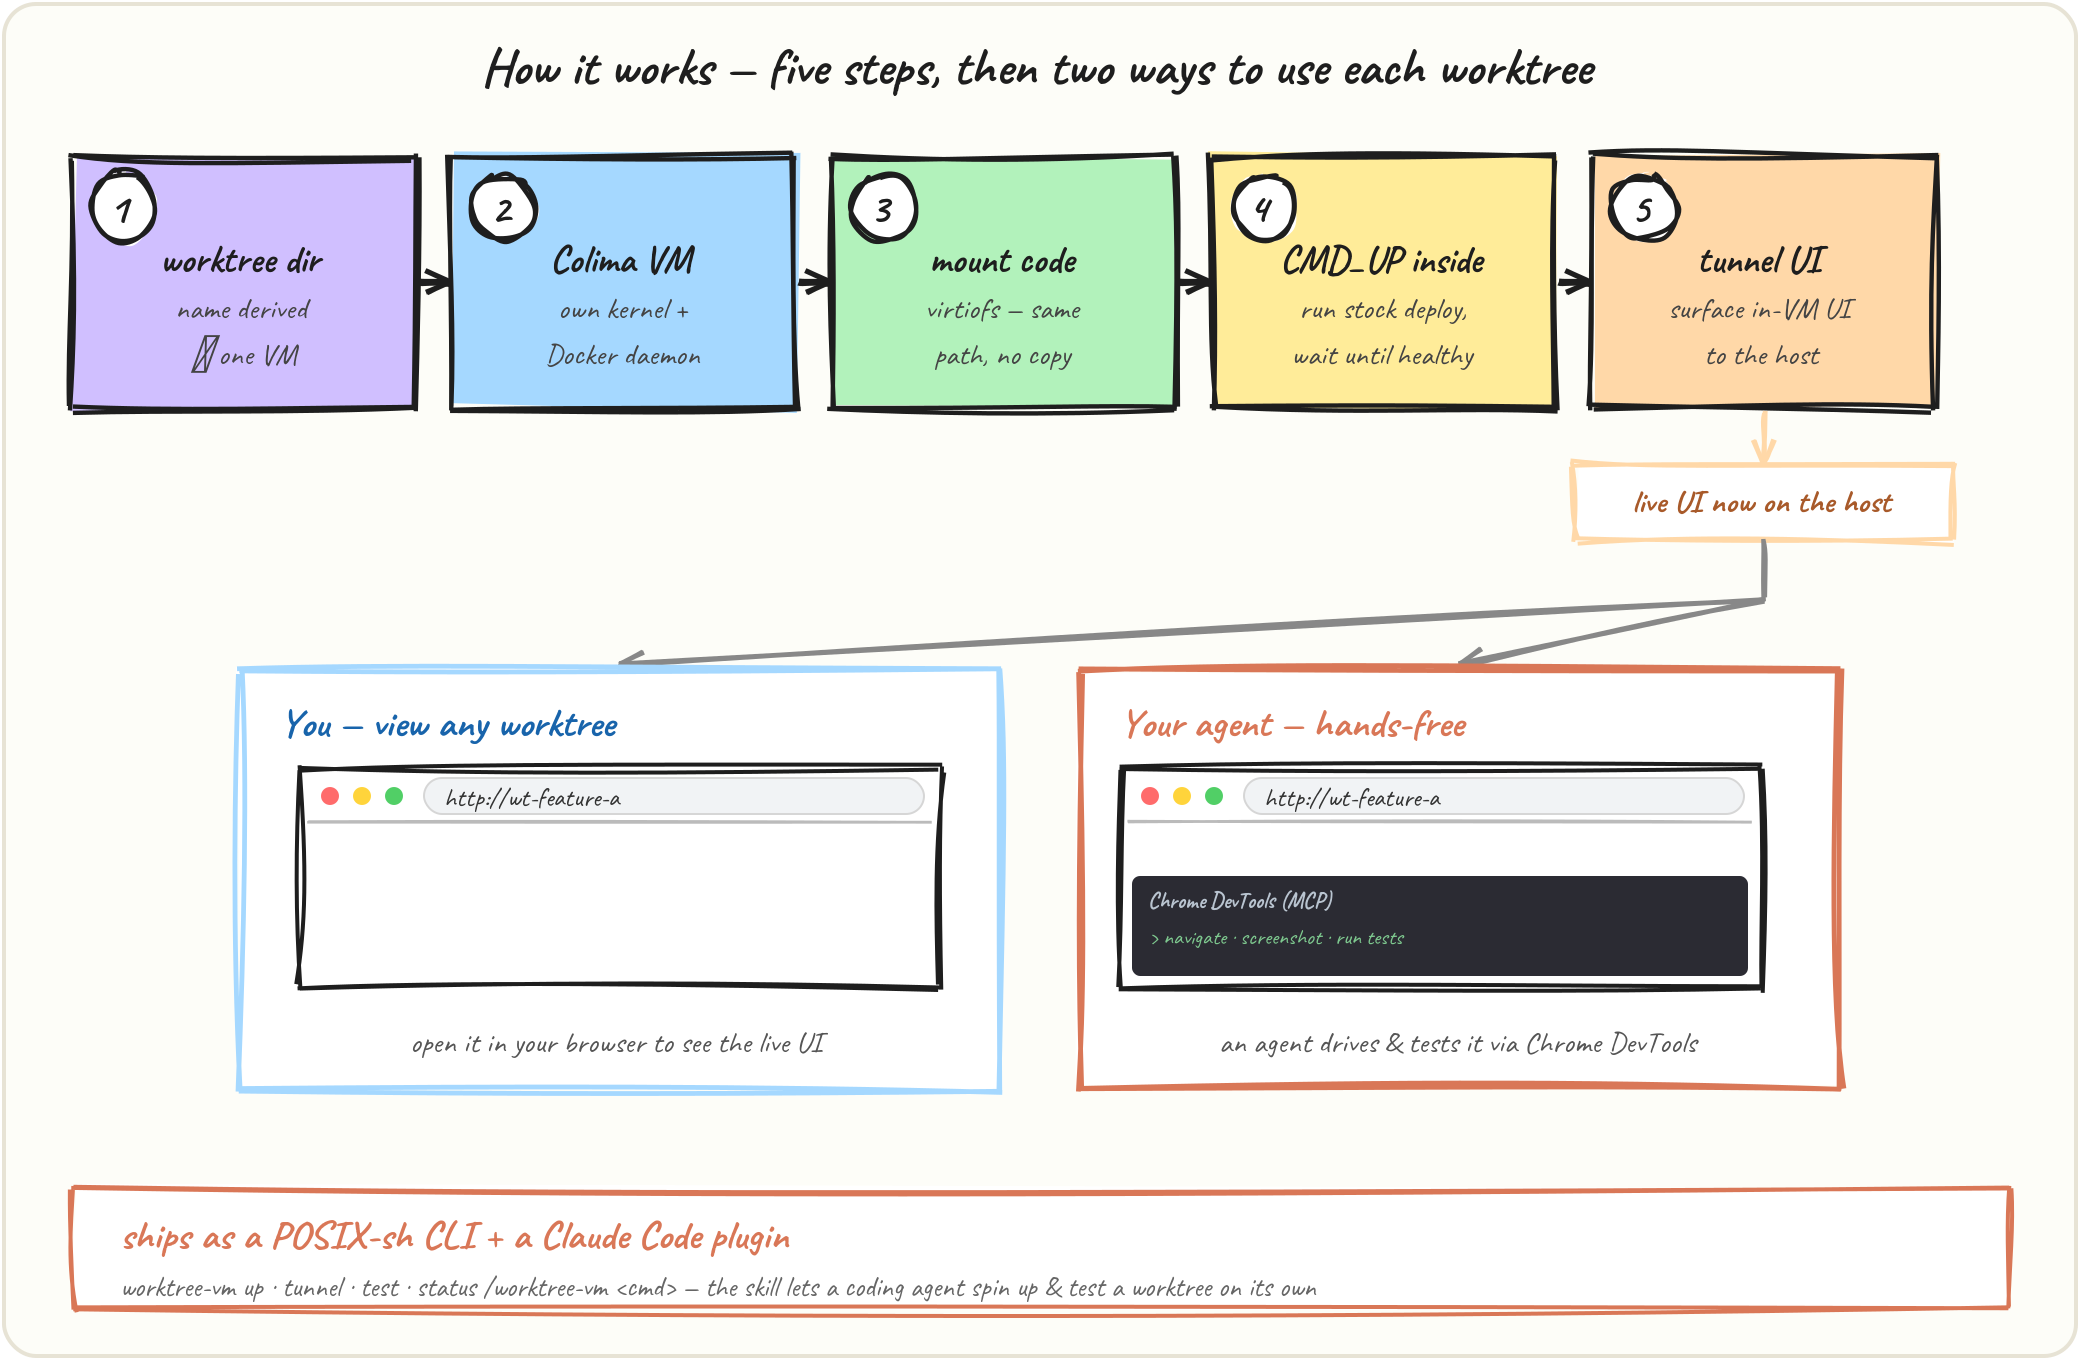
To try the isolation part on your own repo: brew install voycey/vmoat/vmoat, then vmoat up from any worktree, with Colima and a docker CLI installed first. Budget 12 to 15 minutes for that first build; after that, images are cached and rebuilds run at normal speed.