A 0.6B model was starving on the CPU: moving citation highlighting to the GPU
Citation highlighting ate 50 s of a 71 s query on our DGX Spark. The encoder was tiny; the CPU was full. Moving it to the idle GPU: 3.6 s to 0.08 s per chunk.
A retrieval query on our GX10 took 71 seconds. About 50 of those seconds went to a 0.6B encoder deciding which sentences in the cited chunks to highlight, while the GPU next to it sat at 0% utilisation.
It took me longer than it should have to see why: with nothing else running, the model does about 75 ms of work per chunk. It was taking 3.6 seconds, and nothing was wrong with the model.
What the highlighting step does
Certant cites the chunks behind an answer, and the UI highlights the supporting sentences. zilliz/semantic-highlight-bilingual-v1, a 0.6B Provence/OpenProvence encoder, does that scoring in-process inside rag_service, run once per cited chunk, sequentially.
Fourteen cited chunks at 3.6 s each is roughly 50 seconds of a 71 second query; retrieval and generation accounted for the rest.
Earlier releases (v1.8.19, v1.8.20, v1.8.23) fixed loading, not placement: they killed cold-start cache misses and pinned a transformers version. I'd filed the model as dealt with, but it had been running on the CPU the whole time.
Timing the model in isolation
My first theory was the obvious one: the GPU is faster. I timed the encoder on a quiet box, on both devices, before changing anything: about 75 ms per chunk either way, no raw speedup, since a 0.6B model with short inputs doesn't give an accelerator enough work to matter.
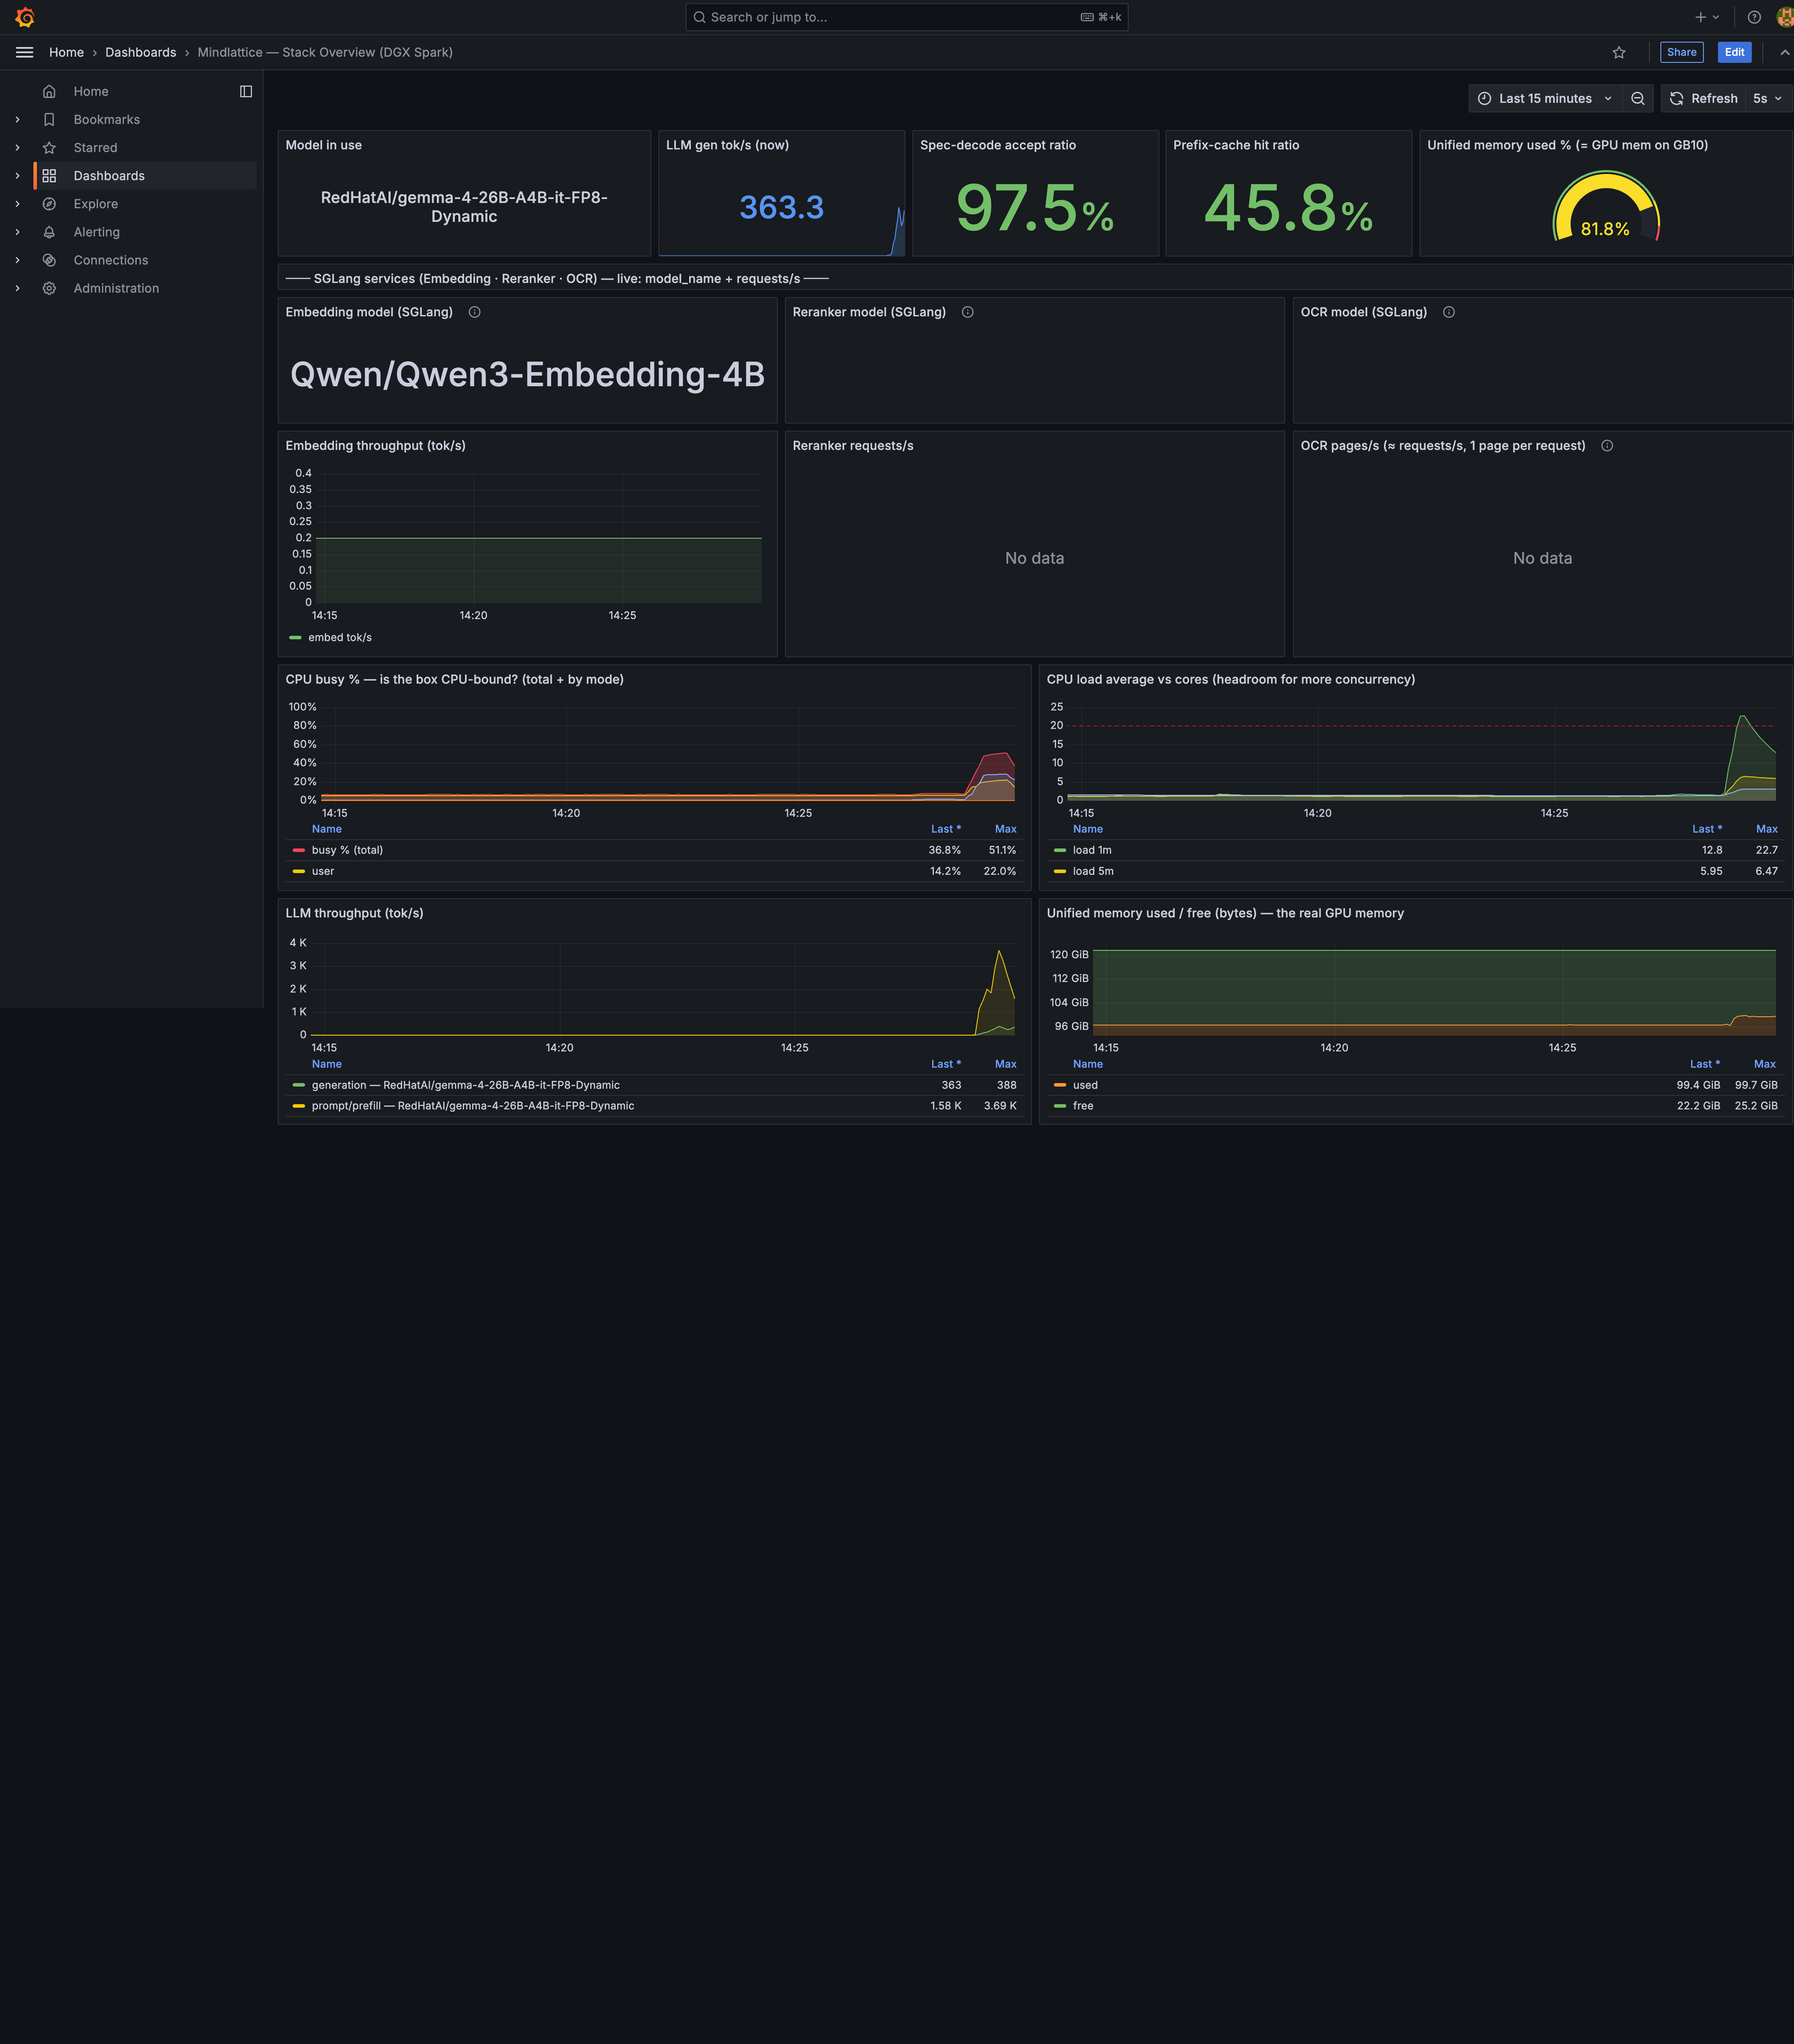
I timed it again during a live benchmark run: 2 to 3.6 seconds per chunk, roughly 40x slower, while a single large torch matmul on the same loaded box still came back in about 33 ms. A big matmul is one op, dispatched once; the encoder's forward pass is hundreds of small ops that each need a free CPU slot, and under load those waits become the runtime.
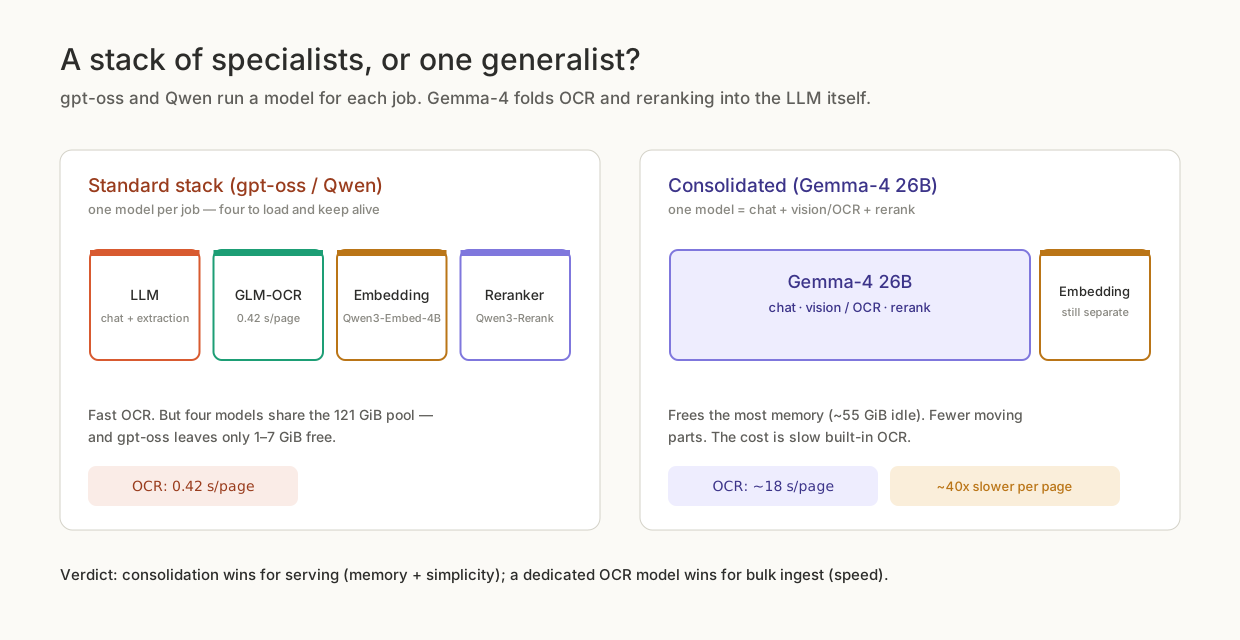
sglang::scheduler, the Qwen embedding server on the same machine, busy-polls and pins a full core at 100%. Add extraction workers and OCR and the box is oversubscribed: load average hit 27 on 20 cores.
Since the encoder runs at about the same speed on either device, moving it to the GPU just takes it off a contended resource: about 77 ms per chunk on the same busy box, regardless of what the CPU is doing.
The fix
The change is a handful of lines in semantic_highlight.get_model(), plus a GPU grant for the rag_service container in the GB10 compose file. There's no new service, and highlight_chunks is untouched; the model's own process() moves inputs to the right device.
# rag_service/semantic_highlight.py - get_model()
want = os.environ.get("SEMANTIC_HIGHLIGHT_DEVICE", "auto").strip().lower()
try:
    import torch
    if want == "auto":
        want = "cuda" if torch.cuda.is_available() else "cpu"
    if want == "cuda" and torch.cuda.is_available():
        _model = _model.to("cuda")
except Exception as dev_err:
    # highlighting is non-critical: any placement error stays on CPU
    ...
The device is a config field (semantic_highlight_device in rag_config.py, env SEMANTIC_HIGHLIGHT_DEVICE), defaulting to auto; the GB10 compose override adds the GPU reservation and sets it:
# gemma4-consolidation/docker-compose.gemma4.yml (GB10 only)
rag_service:
  deploy: *gpu-reservation
  environment:
    SEMANTIC_HIGHLIGHT_DEVICE: ${SEMANTIC_HIGHLIGHT_DEVICE:-auto}
With no GPU visible, auto resolves to cpu: production EPYC and the ARM staging box are unaffected, and the GPU grant exists only in the GB10 compose file. Any placement error is caught and the model stays on the CPU: unhighlighted citations are a minor annoyance, a 500 is not. The encoder needs about 1.5 GiB of GPU memory against roughly 55 GiB free once the model and embedding server are loaded.
Measured on the GX10 with highlighting on:
| Measurement | CPU (in-process, contended) | GPU (in-process) |
|---|---|---|
| Per cited chunk | ~3.6 s | ~0.08 s |
| 14-chunk query, end to end | 71 s | 10.5 s |
| Encoder in isolation, quiet box | ~75 ms | ~75 ms |
On an idle machine the change makes no difference; on a busy one it's 45x, and GPU output still matches CPU output on the same inputs.
An earlier attempt ran the encoder in a separate highlighting microservice. That worked, and I credited process isolation, but the real cause was the microservice sitting on the GPU. I deleted it and kept the placement.
Testing the fix on a Cython-compiled image
Our customer rag-service image is Cython-compiled for source protection, so semantic_highlight ships as semantic_highlight.cpython-311-aarch64-linux-gnu.so. A compiled .so shadows a same-named .py: copying a patched file in and restarting changes nothing, since the interpreter never reads it.
The supported path is rebuilding the image so the .so recompiles. To test live on the GX10 without a rebuild, I moved the compiled module aside so the patched .py would load:
mv .../semantic_highlight.cpython-311-aarch64-linux-gnu.so{,.bak}
# copy in the patched .py, then restart rag_service
Fine for a one-off proof on a box I own, not something to leave in place: the next image pull silently reverts it.
Staging is slow too, for a different reason
While I was in here I wrote down something the team keeps re-discovering: staging's retrieval queries run 4 to 5 times slower than production, and it's the same highlighting step doing it.
Per-chunk highlight latency, measured across our three environments on 4 June 2026:
| Host | CPU | Per chunk | 26-cited-chunk query |
|---|---|---|---|
| local dev | Apple M-series | ~0.75 s | ~20 s |
| production / demo | AMD EPYC Zen-4 (AVX-512 + BF16) | ~0.93 s | ~24 s |
| staging | ARM Neoverse-N1, 4 vCPU, no bf16/i8mm | ~3.6 s | ~93 s |
Staging lands on the same 3.6 s per chunk as the starved GX10 CPU path, for an unrelated reason: the GX10 has 20 capable cores that are all busy; staging has 4 cores that lack the bf16 and i8mm instructions the encoder wants.
A chunk-heavy query on staging can take 90 seconds or more: expected for this hardware, not a hang or a regression. Run staging tests one query at a time: concurrent queries serialise on the singleton highlight model and the 4 cores, roughly doubling that again.
Two fixes we tried on staging didn't work: batching the encoder's process() call over multiple contexts hangs in preprocessing, and bf16/int8 give no speedup on the Neoverse-N1 (no bf16/i8mm flags means bf16 is emulated and slower, int8 has no backend to run on). The real fixes, a batched model path, a remote GPU highlight endpoint, or a non-blocking pass, aren't done: staging latency hasn't been worth the work yet.
What to check on your own box
If you're running a small model in-process next to a serving engine, this is the sequence that would have saved me the afternoon:
- Time the model in isolation on a quiet box. If isolated latency is fine but production latency is 40x worse, the scheduler is the problem.
- Check load average against core count while the slow path runs: 27 on 20 cores is not subtle.
- Check whether your inference server busy-polls. SGLang's scheduler holds a core at 100% even when idle, taking it from everything else on the box.
- Time one large matmul on the same loaded box. If it's unaffected while the small-op model crawls, that's dispatch starvation.
- Check the GPU is visible inside the container, not just the host:
torch.cuda.is_available()must return true there, which on Docker needs the reservation in compose. - If your image is compiled, confirm which file the interpreter loaded before concluding your patch did nothing.
The follow-up is still unmeasured: the three highlight_chunks call sites in query.py are still synchronous, so the pass, about a second for 14 chunks instead of 50, still blocks the event loop. Wrapping them in asyncio.to_thread is the obvious next move and needs an image rebuild, since query.py is compiled too. I also haven't tried backing off the SGLang scheduler's poll interval, which might free up a core.